| ||||||||||||||||||||||||||||||||||
All 118 seats in the Illinois House of Representatives 60 seats needed for a majority | ||||||||||||||||||||||||||||||||||
|---|---|---|---|---|---|---|---|---|---|---|---|---|---|---|---|---|---|---|---|---|---|---|---|---|---|---|---|---|---|---|---|---|---|---|
| ||||||||||||||||||||||||||||||||||

Results: Democratic gain Republican gain Democratic hold Republican hold Vote Share: 40–50% 50–60% 60–70% 70–80% 80–90% >90% 40–50% 50–60% 60–70% 70–80% >90% | ||||||||||||||||||||||||||||||||||
| ||||||||||||||||||||||||||||||||||


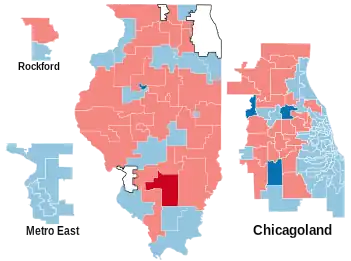
The Illinois House of Representatives elections of 2008 determined the membership of the lower house of the 96th General Assembly. The Democratic Party increased its Majority.
Overview
| Illinois State Senate Elections, 2008 | |||||||
|---|---|---|---|---|---|---|---|
| Party | Votes | Percentage | Seats before |
Seats after |
+/– | ||
| Democratic | 2,785,589 | 58.03% | 67 | 70 | +3 | ||
| Republican | 1,949,123 | 40.60% | 51 | 48 | -3 | ||
| Green | 65,647 | 1.30% | 0 | 0 | 0 | ||
| Independent | 36 | 0.0007% | 0 | 0 | 0 | ||
| Totals | 4,800,359 | 100.00% | 118 | 0 | 118 | ||
References
| Elections in Illinois |
|---|
 |
Sources
- Illinois State Board of Elections
This article is issued from Wikipedia. The text is licensed under Creative Commons - Attribution - Sharealike. Additional terms may apply for the media files.