| |||||||||||||||||||||||||||||||
All 118 seats in the Illinois House of Representatives 60 seats needed for a majority | |||||||||||||||||||||||||||||||
|---|---|---|---|---|---|---|---|---|---|---|---|---|---|---|---|---|---|---|---|---|---|---|---|---|---|---|---|---|---|---|---|
| |||||||||||||||||||||||||||||||
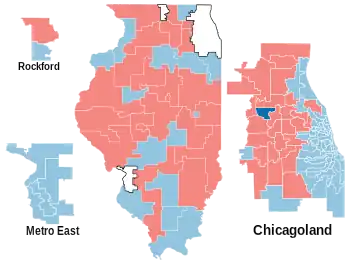
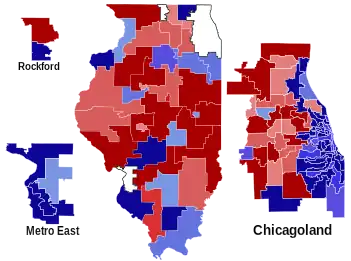
Results: Democratic gain Democratic hold Republican hold Vote Share: 50–60% 60–70% 70–80% 80–90% >90% 50–60% 60–70% 70–80% >90% | |||||||||||||||||||||||||||||||
| |||||||||||||||||||||||||||||||


The Illinois House of Representatives elections of 2006 determined the membership of the lower house of the 95th General Assembly. The Democratic Party increased its Majority.
Overview
| Illinois State House of Representatives Elections, 2006 | |||||||
|---|---|---|---|---|---|---|---|
| Party | Votes | Percentage | Seats before |
Number of Candidates |
Seats after |
+/– | |
| Democratic | 1,701,735 | 53.64% | 65 | 91 | 66 | +1 | |
| Republican | 1,454,770 | 45.85% | 53 | 84 | 52 | -1 | |
| Green | 65,647 | 0.50% | 0 | 4 | 0 | 0 | |
| Independent | 49 | 0.00% | 0 | 5 | 0 | 0 | |
| Totals | 3,172,566 | 100.00% | 118 | 184 | 118 | 0 | |
This article is issued from Wikipedia. The text is licensed under Creative Commons - Attribution - Sharealike. Additional terms may apply for the media files.