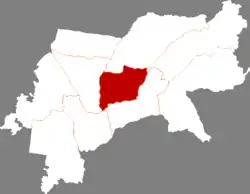
Wangkui County
望奎县 | |
|---|---|
 Fenjin Road, Wangkui County | |
 Wangkui in Suihua | |
.png.webp) Suihua in Heilongjiang | |
| Coordinates: 46°49′59″N 126°29′10″E / 46.833°N 126.486°E | |
| Country | People's Republic of China |
| Province | Heilongjiang |
| Prefecture-level city | Suihua |
| Area | |
| • Total | 2,313.78 km2 (893.36 sq mi) |
| Population (2010) | |
| • Total | 458,725 |
| • Density | 200/km2 (510/sq mi) |
| Time zone | UTC+8 (China Standard) |
Wangkui County (simplified Chinese: 望奎县; traditional Chinese: 望奎縣; pinyin: Wàngkuí Xiàn) is a county of western Heilongjiang province, People's Republic of China. It is under the jurisdiction of the prefecture-level city of Suihua.
Wankui in its Chinese name could be translated as Watch Kui. Kui represents the old name of QiqiHaer which is the second largest city in Heilongjiang province. Because the terrain of Wangkui is high, people in the past are able to watch Kui. And that is the why this little county is called Wang(Watch)kui.
One of the most famous cultural icon of this county is traditional Chinese barbecue. Two thirds of restaurants in this county would be a barbecue restaurant. Big stick with fat meat is no more popular here, locals appreciate small stick with small pieces of meat.
This county has four elementary schools and four secondary schools. It also has two high schools, No.1 High school and No.2 High school. Most students who want to have 'Gaokao' would choose to study at No.1 High school; and those who have talents about music and painting would go to No.2 High school.
Administrative divisions
Wangkui County is divided into 4 subdistricts, 9 towns, 1 ethnic town, 3 townships and 2 ethnic townships.[1]
- 4 subdistricts
- Dongfeng (东风街道), Qianjin (前进街道), Dongsheng (东胜街道), Xing'an (兴安街道)
- 9 towns
- Wangkui (望奎镇), Tongjiang (通江镇), Weixing (卫星镇), Haifeng (海丰镇), Lianhua (莲花镇), Xianfeng (先锋镇), Yezi (叶子镇), Dongjiao (东郊镇), Dengta (灯塔镇)
- 1 ethnic town
- Huiqi Manchu (惠七满族镇)
- 3 townships
- Housan (后三乡), Dongsheng (东升乡), Gongliu (恭六乡)
- 2 ethnic townships
- Lingshan Manchu (灵山满族乡), Xiangbai Manchu (厢白满族乡)
Demographics
The population of the district was 453,404 in 1999.[2]
Climate
| Climate data for Wangkui (1991–2020 normals, extremes 1981–2010) | |||||||||||||
|---|---|---|---|---|---|---|---|---|---|---|---|---|---|
| Month | Jan | Feb | Mar | Apr | May | Jun | Jul | Aug | Sep | Oct | Nov | Dec | Year |
| Record high °C (°F) | −0.8 (30.6) |
7.8 (46.0) |
19.8 (67.6) |
30.1 (86.2) |
34.7 (94.5) |
39.3 (102.7) |
37.2 (99.0) |
35.4 (95.7) |
31.4 (88.5) |
26.4 (79.5) |
15.3 (59.5) |
5.3 (41.5) |
39.3 (102.7) |
| Mean daily maximum °C (°F) | −13.9 (7.0) |
−7.9 (17.8) |
1.9 (35.4) |
13.0 (55.4) |
21.3 (70.3) |
26.3 (79.3) |
27.7 (81.9) |
26.0 (78.8) |
20.9 (69.6) |
11.4 (52.5) |
−1.6 (29.1) |
−11.9 (10.6) |
9.4 (49.0) |
| Daily mean °C (°F) | −19.6 (−3.3) |
−14.3 (6.3) |
−4.2 (24.4) |
6.7 (44.1) |
15.0 (59.0) |
20.7 (69.3) |
22.9 (73.2) |
20.9 (69.6) |
14.6 (58.3) |
5.4 (41.7) |
−6.8 (19.8) |
−17.0 (1.4) |
3.7 (38.7) |
| Mean daily minimum °C (°F) | −24.4 (−11.9) |
−20.2 (−4.4) |
−9.9 (14.2) |
0.5 (32.9) |
8.4 (47.1) |
15.0 (59.0) |
18.4 (65.1) |
16.3 (61.3) |
8.9 (48.0) |
0.1 (32.2) |
−11.2 (11.8) |
−21.4 (−6.5) |
−1.6 (29.1) |
| Record low °C (°F) | −39.1 (−38.4) |
−37.2 (−35.0) |
−29.0 (−20.2) |
−11.5 (11.3) |
−4.3 (24.3) |
3.8 (38.8) |
8.7 (47.7) |
5.7 (42.3) |
−5.5 (22.1) |
−15.6 (3.9) |
−28.6 (−19.5) |
−34.6 (−30.3) |
−39.1 (−38.4) |
| Average precipitation mm (inches) | 3.5 (0.14) |
2.9 (0.11) |
9.3 (0.37) |
20.7 (0.81) |
39.6 (1.56) |
103.5 (4.07) |
161.4 (6.35) |
116.3 (4.58) |
49.1 (1.93) |
21.2 (0.83) |
8.1 (0.32) |
5.3 (0.21) |
540.9 (21.28) |
| Average precipitation days (≥ 0.1 mm) | 4.5 | 2.9 | 4.8 | 6.3 | 10.5 | 13.7 | 13.7 | 13.2 | 8.3 | 6.1 | 5.1 | 6.1 | 95.2 |
| Average snowy days | 6.4 | 4.7 | 5.8 | 2.8 | 0.1 | 0 | 0 | 0 | 0 | 1.7 | 6.6 | 8.1 | 36.2 |
| Average relative humidity (%) | 72 | 68 | 58 | 50 | 51 | 64 | 77 | 79 | 69 | 61 | 66 | 72 | 66 |
| Mean monthly sunshine hours | 161.8 | 193.9 | 237.8 | 235.5 | 262.0 | 248.0 | 242.0 | 233.6 | 232.0 | 198.0 | 164.3 | 144.3 | 2,553.2 |
| Percent possible sunshine | 58 | 66 | 64 | 57 | 56 | 53 | 51 | 54 | 62 | 60 | 59 | 55 | 58 |
| Source: China Meteorological Administration[3][4] | |||||||||||||
Notes and references
- ↑ "国家统计局" (in Chinese). National Bureau of Statistics of the People's Republic of China. Retrieved 2021-12-07.
- ↑ (in English) National Population Statistics Materials by County and City - 1999 Period, in China County & City Population 1999, Harvard China Historical GIS
- ↑ 中国气象数据网 – WeatherBk Data (in Simplified Chinese). China Meteorological Administration. Retrieved 5 July 2023.
- ↑ 中国气象数据网 (in Simplified Chinese). China Meteorological Administration. Retrieved 5 July 2023.