Soeda
添田町 | |
|---|---|
Town | |
 Flag | |
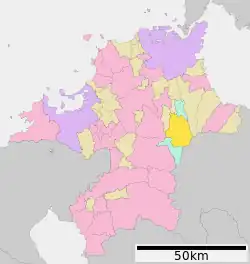 Location of Soeda in Fukuoka Prefecture | |
 Soeda Location in Japan | |
| Coordinates: 33°34′N 130°51′E / 33.567°N 130.850°E | |
| Country | Japan |
| Region | Kyushu |
| Prefecture | Fukuoka Prefecture |
| District | Tagawa |
| Area | |
| • Total | 132.10 km2 (51.00 sq mi) |
| Population (2016) | |
| • Total | 9,802 |
| • Density | 74/km2 (190/sq mi) |
| Time zone | UTC+09:00 (JST) |
| Climate | Cfa |
| Website | www |
Soeda (添田町, Soeda-machi) is a town located in Tagawa District, Fukuoka Prefecture, Japan. As of 2016, the town has an estimated population of 9,802 and a density of 74 persons per km². The total area is 132.10 km².
Geography
Climate
Soeda has a humid subtropical climate (Köppen: Cfa). The average annual temperature in Soeda is 15.3 °C (59.5 °F). The average annual rainfall is 1,970.5 mm (77.58 in) with July as the wettest month. The temperatures are highest on average in August, at around 26.5 °C (79.7 °F), and lowest in January, at around 4.7 °C (40.5 °F).[1] The highest temperature ever recorded in Soeda was 37.8 °C (100.0 °F) on 14 August 2018; the coldest temperature ever recorded was −7.5 °C (18.5 °F) on 9 January 2021.[2]
| Climate data for Soeda (1991−2020 normals, extremes 1977−present) | |||||||||||||
|---|---|---|---|---|---|---|---|---|---|---|---|---|---|
| Month | Jan | Feb | Mar | Apr | May | Jun | Jul | Aug | Sep | Oct | Nov | Dec | Year |
| Record high °C (°F) | 20.4 (68.7) |
23.7 (74.7) |
25.5 (77.9) |
29.9 (85.8) |
32.6 (90.7) |
35.9 (96.6) |
37.2 (99.0) |
37.8 (100.0) |
35.5 (95.9) |
33.2 (91.8) |
26.5 (79.7) |
23.4 (74.1) |
37.8 (100.0) |
| Mean daily maximum °C (°F) | 9.0 (48.2) |
10.5 (50.9) |
14.2 (57.6) |
19.8 (67.6) |
24.7 (76.5) |
27.1 (80.8) |
31.0 (87.8) |
32.0 (89.6) |
28.0 (82.4) |
22.8 (73.0) |
17.0 (62.6) |
11.4 (52.5) |
20.6 (69.1) |
| Daily mean °C (°F) | 4.7 (40.5) |
5.6 (42.1) |
8.8 (47.8) |
13.8 (56.8) |
18.5 (65.3) |
22.0 (71.6) |
25.9 (78.6) |
26.5 (79.7) |
22.6 (72.7) |
17.2 (63.0) |
11.8 (53.2) |
6.7 (44.1) |
15.3 (59.6) |
| Mean daily minimum °C (°F) | 0.9 (33.6) |
1.2 (34.2) |
4.0 (39.2) |
8.4 (47.1) |
13.1 (55.6) |
17.9 (64.2) |
22.2 (72.0) |
22.5 (72.5) |
18.7 (65.7) |
12.8 (55.0) |
7.5 (45.5) |
2.7 (36.9) |
11.0 (51.8) |
| Record low °C (°F) | −7.5 (18.5) |
−6.6 (20.1) |
−5.8 (21.6) |
−0.8 (30.6) |
4.1 (39.4) |
7.7 (45.9) |
12.6 (54.7) |
14.6 (58.3) |
7.2 (45.0) |
2.2 (36.0) |
−0.6 (30.9) |
−4.6 (23.7) |
−7.5 (18.5) |
| Average precipitation mm (inches) | 79.7 (3.14) |
84.8 (3.34) |
129.1 (5.08) |
142.6 (5.61) |
159.8 (6.29) |
327.2 (12.88) |
364.4 (14.35) |
213.8 (8.42) |
204.0 (8.03) |
100.1 (3.94) |
92.8 (3.65) |
74.7 (2.94) |
1,970.5 (77.58) |
| Average precipitation days (≥ 1.0 mm) | 11.0 | 10.4 | 11.3 | 10.7 | 9.8 | 13.4 | 13.6 | 10.9 | 10.7 | 7.7 | 9.1 | 10.0 | 128.6 |
| Mean monthly sunshine hours | 104.5 | 117.0 | 154.6 | 189.3 | 201.4 | 134.2 | 165.3 | 194.3 | 148.9 | 169.6 | 135.8 | 111.0 | 1,825.9 |
| Source: Japan Meteorological Agency[1][2] | |||||||||||||
Demographics
Per Japanese census data, the population of Soeda in 2020 is 8,801 people.[3] Soeda has been conducting censuses since 1920.
| Year | Pop. | ±% |
|---|---|---|
| 1920 | 33,418 | — |
| 1925 | 19,936 | −40.3% |
| 1930 | 20,063 | +0.6% |
| 1935 | 20,186 | +0.6% |
| 1940 | 23,022 | +14.0% |
| 1945 | 25,249 | +9.7% |
| 1950 | 27,658 | +9.5% |
| 1955 | 27,978 | +1.2% |
| 1960 | 25,170 | −10.0% |
| 1965 | 20,067 | −20.3% |
| 1970 | 16,810 | −16.2% |
| 1975 | 16,006 | −4.8% |
| 1980 | 16,196 | +1.2% |
| 1985 | 15,662 | −3.3% |
| 1990 | 14,632 | −6.6% |
| 1995 | 13,763 | −5.9% |
| 2000 | 12,750 | −7.4% |
| 2005 | 11,810 | −7.4% |
| 2010 | 10,913 | −7.6% |
| 2015 | 9,924 | −9.1% |
| 2020 | 8,801 | −11.3% |
| Soeda population statistics[3] | ||
References
- 1 2 気象庁 / 平年値(年・月ごとの値). JMA. Retrieved May 23, 2022.
- 1 2 観測史上1~10位の値(年間を通じての値). JMA. Retrieved May 23, 2022.
- 1 2 Soeda population statistics
External links
 Media related to Soeda, Fukuoka at Wikimedia Commons
- Soeda official website (in Japanese)