Sainte-Marie-Madeleine | |
|---|---|
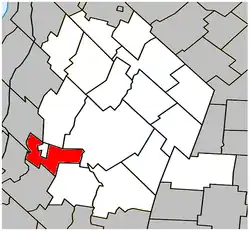 Location within Les Maskoutains RCM. | |
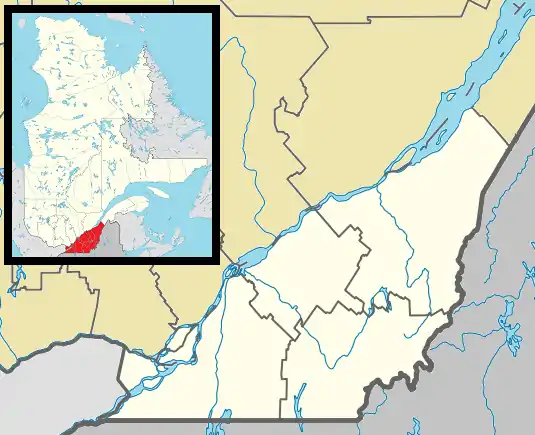 Sainte-Marie-Madeleine Location in southern Quebec. | |
| Coordinates: 45°36′N 73°06′W / 45.600°N 73.100°W[1] | |
| Country | |
| Province | |
| Region | Montérégie |
| RCM | Les Maskoutains |
| Constituted | August 13, 1879 |
| Government | |
| • Mayor | Gilles Carpentier |
| • Federal riding | Saint-Hyacinthe—Bagot |
| • Prov. riding | Borduas |
| Area | |
| • Total | 49.80 km2 (19.23 sq mi) |
| • Land | 50.87 km2 (19.64 sq mi) |
| There is an apparent contradiction between two authoritative sources | |
| Population | |
| • Total | 2,935 |
| • Density | 57.7/km2 (149/sq mi) |
| • Pop 2006-2011 | |
| • Dwellings | 1,141 |
| Time zone | UTC−5 (EST) |
| • Summer (DST) | UTC−4 (EDT) |
| Postal code(s) | |
| Area code(s) | 450 and 579 |
| Highways | |
| Website | www.sainte-marie -madeleine.ca |
Sainte-Marie-Madeleine is a parish municipality in southwestern Quebec, Canada, in Les Maskoutains Regional County Municipality. The population as of the Canada 2011 Census was 2,935.
Demographics
| Year | Pop. | ±% |
|---|---|---|
| 1991 | 2,113 | — |
| 1996 | 2,262 | +7.1% |
| 2001 | 2,466 | +9.0% |
| 2006 | 2,678 | +8.6% |
| 2011 | 2,935 | +9.6% |
In the 2021 Census of Population conducted by Statistics Canada, Sainte-Marie-Madeleine had a population of 2,876 living in 1,169 of its 1,190 total private dwellings, a change of -0.6% from its 2016 population of 2,892. With a land area of 50.04 km2 (19.32 sq mi), it had a population density of 57.5/km2 (148.9/sq mi) in 2021.[6]
Canada census – Sainte-Marie-Madeleine community profile
| 2021 | 2011 | |
|---|---|---|
| Population | 2,876 (-0.6% from 2016) | 2,935 (+9.6% from 2006) |
| Land area | 50.04 km2 (19.32 sq mi) | 50.87 km2 (19.64 sq mi) |
| Population density | 57.5/km2 (149/sq mi) | 57.7/km2 (149/sq mi) |
| Median age | 42.4 (M: 42, F: 42.4) | 38.3 (M: 38.1, F: 39.0) |
| Private dwellings | 1,170 (total) | 1,141 (total) |
| Median household income | $62,152 |
| Canada Census Mother Tongue - Sainte-Marie-Madeleine, Quebec[5] | ||||||||||||||||||
|---|---|---|---|---|---|---|---|---|---|---|---|---|---|---|---|---|---|---|
| Census | Total | French |
English |
French & English |
Other | |||||||||||||
| Year | Responses | Count | Trend | Pop % | Count | Trend | Pop % | Count | Trend | Pop % | Count | Trend | Pop % | |||||
2011 |
2,935 |
2,855 | 97.27% | 35 | 1.19% | 20 | 0.68% | 25 | 0.85% | |||||||||
2006 |
2,650 |
2,490 | 93.96% | 50 | 1.89% | 10 | 0.38% | 100 | 3.77% | |||||||||
2001 |
2,460 |
2,410 | 97.97% | 15 | 0.61% | 15 | 0.61% | 20 | 0.81% | |||||||||
1996 |
2,265 |
2,180 | n/a | 96.25% | 55 | n/a | 2.43% | 10 | n/a | 0.44% | 20 | n/a | 0.88% | |||||
See also
References
- ↑ "Banque de noms de lieux du Québec: Reference number 56329". toponymie.gouv.qc.ca (in French). Commission de toponymie du Québec.
- 1 2 Ministère des Affaires municipales, des Régions et de l'Occupation du territoire: Sainte-Marie-Madeleine
- ↑ Parliament of Canada Federal Riding History: SAINT-HYACINTHE--BAGOT (Quebec)
- 1 2 3 "2011 Community Profiles". 2011 Canadian Census. Statistics Canada. March 21, 2019. Retrieved 2014-03-25.
- 1 2 Statistics Canada: 1996, 2001, 2006, 2011 census
- ↑ "Population and dwelling counts: Canada, provinces and territories, and census subdivisions (municipalities), Quebec". Statistics Canada. February 9, 2022. Retrieved August 29, 2022.
- ↑ "2021 Community Profiles". 2021 Canadian Census. Statistics Canada. February 4, 2022. Retrieved 2022-04-27.
- ↑ "2006 Community Profiles". 2006 Canadian Census. Statistics Canada. August 20, 2019.
- ↑ "2001 Community Profiles". 2001 Canadian Census. Statistics Canada. July 18, 2021.
Adjacent Municipal Subdivisions | ||||||||||||||||
|---|---|---|---|---|---|---|---|---|---|---|---|---|---|---|---|---|
| ||||||||||||||||
| Cities | |
|---|---|
| Municipalities | |
| Parishes | |
| Villages | |
| |
This article is issued from Wikipedia. The text is licensed under Creative Commons - Attribution - Sharealike. Additional terms may apply for the media files.