| |||||||||||||||||||||||||||||||||||||||||||||||||||||||||||||||||||||||||||||
All 460 seats to the Sejm 231 seats were needed for a majority in the Sejm All 100 seats to the Senate of Poland | |||||||||||||||||||||||||||||||||||||||||||||||||||||||||||||||||||||||||||||
|---|---|---|---|---|---|---|---|---|---|---|---|---|---|---|---|---|---|---|---|---|---|---|---|---|---|---|---|---|---|---|---|---|---|---|---|---|---|---|---|---|---|---|---|---|---|---|---|---|---|---|---|---|---|---|---|---|---|---|---|---|---|---|---|---|---|---|---|---|---|---|---|---|---|---|---|---|---|
| Opinion polls | |||||||||||||||||||||||||||||||||||||||||||||||||||||||||||||||||||||||||||||
| Turnout | 18,678,457 (53.82%) (Sejm) 16,475,672 (53.81%) (Senate) 53.88% | ||||||||||||||||||||||||||||||||||||||||||||||||||||||||||||||||||||||||||||
| |||||||||||||||||||||||||||||||||||||||||||||||||||||||||||||||||||||||||||||
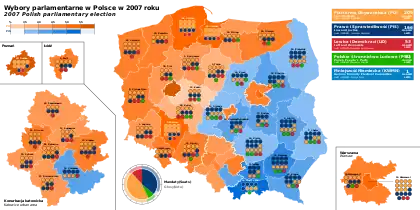 Seats won by Sejm District | |||||||||||||||||||||||||||||||||||||||||||||||||||||||||||||||||||||||||||||
| |||||||||||||||||||||||||||||||||||||||||||||||||||||||||||||||||||||||||||||
 |
|---|
Parliamentary elections were held in Poland on 21 October 2007,[2] after the Sejm voted for its own dissolution on 7 September. The election took place two years before the maximum tenure of four years, with the previous elections having been in September 2005. The early elections were a result of serious allegations of massive corruption on the part of Andrzej Lepper, leader of the Self-Defense of the Republic of Poland, whose party served as a junior coalition partner to the government of Prime Minister Jarosław Kaczyński.[3] All 460 seats in the Sejm and all 100 seats in the Senate were up for election.
The election was won by the largest opposition group, Civic Platform (PO), which soundly defeated the ruling Law and Justice (PiS) party and its allies. Throughout the campaign, polls showed conflicting results as to which of the two parties had the greater support, yet by the closing week the polls had swung in favour of Civic Platform. Three other political groups won election into the Sejm, the centre-left Left and Democrats coalition, the agrarian Polish People's Party, and the tiny German Minority group. Both of Law and Justice's former minor coalition partners, the League of Polish Families and the Self-Defense of the Republic of Poland suffered an enormous voter backlash, failing to cross the 5% electoral threshold in order to enter the Sejm. Consequently, both parties lost all of their seats.
Prime Minister and PiS leader Jarosław Kaczyński stepped down from office on 15 November, with Civic Platform leader Donald Tusk sworn in as Poland's Prime Minister on the following day. Civic Platform consequently formed a coalition majority government with the Polish People's Party.
The turnout for the elections was 53.8%, an increase of 13.2% from the 2005 elections, seeing the highest voter turnout in a Polish parliamentary election since the semi-free elections of 1989.
Contesting parties
Only seven parties contested all 41 electoral districts for the Sejm nationwide. They included:
- Law and Justice (PiS)
- Civic Platform (PO)
- Left and Democrats (LiD)
- Polish People's Party (PSL)
- League of Polish Families (LPR)
- Self-Defense of the Republic of Poland (SRP)
- Polish Labour Party (PPP)
Three other parties managed to register in at least one district:
- Women's Party (PK) — 7 districts;
- Patriotic Self-Defense (SOP) — one district;
- German Minority (MN) — one district;
On 26 September 2007, the leader of the National Party of Retirees and Pensioners, Tomasz Mamiński announced his party's withdrawal from the campaign, stating that Polish electoral law and media bias discriminate against smaller parties.[4]
Although only the ten parties mentioned above openly contested elections to the lower house Sejm, there were other groups which entered the race for the Sejm. It is common practice in Polish elections for many smaller parties to register their candidates on the electoral committee lists of the larger parties contesting the election. These included:
- LPR's lists include members of the League of Polish Families, Real Politics Union and Right of the Republic;
- PiS's lists included members of the Polish People's Party "Piast", National People's Movement, Patriotic Movement, Centre Party and Christian-National Union;
- The SRP's lists include candidates from Piotr Ikonowicz's New Left party, Leszek Miller's Polish Left party and Zygmunt Wrzodak's National Congress of Poland;
- LiD's lists include members from Democratic Left Alliance, Social Democracy of Poland, Democratic Party - demokraci.pl, Labour Union, Reason of the Polish Left, Democratic Left Party and Polish Socialist Party;
- The PPP lists include members of the Communist Party of Poland, Union of the Left, Polish Socialist Party, Reason of the Polish Left, Movement for Unemployed Protection and National Forum of Retirees and Pensioners.[5]
29 political groupings and independents contested the elections to the Senate.
The Greens registered in one district to the Senate (Katowice), receiving 4.55% of votes.
Opinion polls
Results
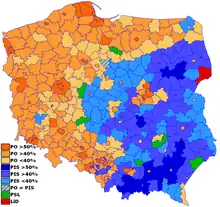
■ – Civic Platform
■ – Law and Justice
■ – Polish People's Party
■ – Left and Democrats
Sejm
 | |||||
|---|---|---|---|---|---|
| Party | Votes | % | Seats | +/– | |
| Civic Platform | 6,701,010 | 41.51 | 209 | +76 | |
| Law and Justice | 5,183,477 | 32.11 | 166 | +11 | |
| Left and Democrats | 2,122,981 | 13.15 | 53 | –2 | |
| Polish People's Party | 1,437,638 | 8.91 | 31 | +6 | |
| Self-Defence of the Republic of Poland | 247,335 | 1.53 | 0 | –56 | |
| League of Polish Families | 209,171 | 1.30 | 0 | –34 | |
| Polish Labour Party | 160,476 | 0.99 | 0 | 0 | |
| Women's Party | 45,121 | 0.28 | 0 | New | |
| German Minority Electoral Committee | 32,462 | 0.20 | 1 | –1 | |
| Patriotic Self-Defense | 2,531 | 0.02 | 0 | New | |
| Total | 16,142,202 | 100.00 | 460 | 0 | |
| Valid votes | 16,142,202 | 97.96 | |||
| Invalid/blank votes | 335,532 | 2.04 | |||
| Total votes | 16,477,734 | 100.00 | |||
| Registered voters/turnout | 30,615,471 | 53.82 | |||
| Source: Nohlen & Stöver | |||||
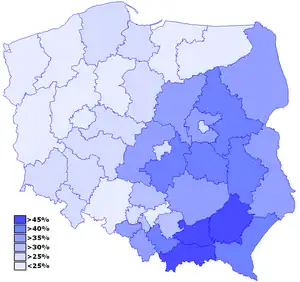
By constituency
| Constituency | Turnout | PO | PiS | LiD | PSL | SRP | LPR | PPP | MN | Others | Lead |
|---|---|---|---|---|---|---|---|---|---|---|---|
| 1 – Legnica | 51.32 | 42.97 | 28.96 | 17.89 | 6.60 | 1.49 | 1.12 | 0.97 | - | 0.00 | 14.01 |
| 2 – Wałbrzych | 48.91 | 46.39 | 26.23 | 15.73 | 7.76 | 1.59 | 1.04 | 1.25 | - | 0.00 | 20.16 |
| 3 – Wrocław | 58.18 | 53.20 | 28.40 | 10.39 | 4.84 | 1.12 | 1.20 | 0.84 | - | 0.00 | 24.80 |
| 4 – Bydgoszcz | 53.26 | 44.09 | 24.21 | 19.01 | 8.71 | 1.71 | 1.07 | 1.20 | - | 0.00 | 19.88 |
| 5 – Toruń | 48.13 | 39.27 | 26.75 | 18.34 | 11.36 | 2.34 | 0.88 | 1.07 | - | 0.00 | 12.52 |
| 6 – Lublin | 53.05 | 29.47 | 41.52 | 10.59 | 12.55 | 1.76 | 1.91 | 0.78 | - | 1.42 | 12.05 |
| 7 – Chełm | 46.23 | 24.09 | 39.51 | 10.50 | 19.38 | 3.30 | 2.10 | 1.12 | - | 0.00 | 15.42 |
| 8 – Zielona Góra | 50.35 | 47.06 | 22.47 | 17.64 | 8.39 | 1.69 | 1.44 | 1.32 | - | 0.00 | 24.59 |
| 9 – Łódź | 61.98 | 45.68 | 27.85 | 17.77 | 3.64 | 1.45 | 1.13 | 0.76 | - | 1.72 | 17.83 |
| 10 – Piotrków Trybunalski | 50.66 | 27.92 | 41.42 | 12.35 | 13.66 | 2.27 | 1.26 | 1.11 | - | 0.00 | 13.50 |
| 11 – Sieradz | 49.46 | 30.46 | 35.14 | 14.03 | 14.05 | 2.71 | 1.22 | 0.92 | - | 1.47 | 4.68 |
| 12 – Chrzanów | 54.73 | 36.43 | 40.40 | 10.70 | 9.01 | 0.97 | 1.52 | 0.98 | - | 0.00 | 3.97 |
| 13 – Kraków | 61.38 | 47.35 | 34.43 | 9.67 | 4.18 | 0.62 | 1.22 | 1.67 | - | 0.86 | 12.92 |
| 14 – Nowy Sącz | 52.27 | 28.76 | 51.35 | 6.40 | 10.28 | 1.23 | 1.32 | 0.67 | - | 0.00 | 22.59 |
| 15 – Tarnów | 52.26 | 32.22 | 45.64 | 7.33 | 11.23 | 1.15 | 1.56 | 0.87 | - | 0.00 | 13.42 |
| 16 – Płock | 47.05 | 29.54 | 35.58 | 11.25 | 19.82 | 1.93 | 0.99 | 0.88 | - | 0.00 | 6.04 |
| 17 – Radom | 50.56 | 28.24 | 42.72 | 8.94 | 15.02 | 2.66 | 1.49 | 0.93 | - | 0.00 | 14.48 |
| 18 – Siedlce | 50.51 | 24.83 | 42.93 | 8.36 | 18.96 | 2.36 | 1.78 | 0.77 | - | 0.00 | 18.10 |
| 19 – Warsaw I | 74.03 | 54.01 | 27.66 | 12.66 | 2.33 | 0.40 | 1.24 | 0.48 | - | 1.22 | 26.35 |
| 20 – Warsaw II | 61.83 | 45.17 | 35.63 | 7.93 | 8.26 | 0.79 | 1.41 | 0.81 | - | 0.00 | 9.54 |
| 21 – Opole | 45.53 | 46.58 | 22.87 | 11.19 | 6.62 | 1.74 | 1.28 | 0.91 | 8.81 | 0.00 | 23.71 |
| 22 – Krosno | 41.10 | 29.30 | 44.19 | 9.21 | 12.96 | 1.81 | 1.49 | 1.05 | - | 0.00 | 14.89 |
| 23 – Rzeszów | 44.24 | 27.81 | 48.43 | 8.78 | 11.16 | 1.09 | 1.84 | 0.89 | - | 0.00 | 20.62 |
| 24 – Białystok | 49.50 | 32.36 | 38.81 | 14.72 | 9.14 | 2.02 | 1.44 | 0.61 | - | 0.90 | 6.45 |
| 25 – Gdańsk | 58.34 | 54.62 | 27.08 | 10.59 | 4.38 | 1.19 | 1.34 | 0.81 | - | 0.00 | 27.54 |
| 26 – Gdynia | 56.80 | 51.03 | 26.55 | 12.45 | 6.12 | 1.37 | 1.56 | 0.93 | - | 0.00 | 24.48 |
| 27 – Bielsko-Biała | 58.84 | 41.76 | 35.41 | 12.81 | 6.62 | 0.91 | 1.14 | 1.34 | - | 0.00 | 6.35 |
| 28 – Częstochowa | 52.94 | 40.12 | 30.88 | 14.76 | 9.79 | 1.53 | 1.55 | 1.36 | - | 0.00 | 9.24 |
| 29 – Gliwice | 50.96 | 49.69 | 29.62 | 13.26 | 4.63 | 0.82 | 0.97 | 1.01 | - | 0.00 | 20.07 |
| 30 – Rybnik | 53.01 | 44.55 | 36.23 | 11.99 | 3.98 | 0.95 | 1.01 | 1.29 | - | 0.00 | 8.32 |
| 31 – Katowice | 57.45 | 49.74 | 31.52 | 12.26 | 3.31 | 0.59 | 0.97 | 1.62 | - | 0.00 | 18.22 |
| 32 – Sosnowiec | 49.73 | 44.75 | 24.98 | 21.61 | 5.03 | 0.93 | 1.16 | 1.56 | - | 0.00 | 19.77 |
| 33 – Kielce | 47.45 | 27.94 | 39.07 | 13.81 | 14.72 | 1.63 | 0.98 | 0.94 | - | 0.91 | 11.13 |
| 34 – Elbląg | 46.89 | 43.34 | 24.26 | 15.43 | 11.42 | 3.00 | 1.40 | 1.14 | - | 0.00 | 19.08 |
| 35 – Olsztyn | 48.90 | 45.25 | 24.15 | 14.07 | 12.61 | 1.70 | 1.30 | 0.92 | - | 0.00 | 21.10 |
| 36 – Kalisz | 50.91 | 38.59 | 26.48 | 16.89 | 13.40 | 2.19 | 1.25 | 1.20 | - | 0.00 | 12.11 |
| 37 – Konin | 50.78 | 34.18 | 29.24 | 17.44 | 13.83 | 2.36 | 1.38 | 1.58 | - | 0.00 | 4.94 |
| 38 – Piła | 51.78 | 41.88 | 21.73 | 19.75 | 12.63 | 2.13 | 0.97 | 0.92 | - | 0.00 | 20.15 |
| 39 – Poznań | 66.68 | 58.60 | 21.04 | 12.63 | 5.45 | 0.60 | 0.99 | 0.68 | - | 0.00 | 37.56 |
| 40 – Koszalin | 49.15 | 45.88 | 21.57 | 17.58 | 8.58 | 4.24 | 1.04 | 1.12 | - | 0.00 | 24.31 |
| 41 – Szczecin | 53.53 | 48.96 | 24.05 | 17.00 | 6.12 | 1.63 | 1.33 | 0.92 | - | 0.00 | 24.91 |
| Poland | 53.88 | 41.51 | 32.11 | 13.15 | 8.91 | 1.53 | 1.30 | 0.99 | 0.20 | 0.30 | 9.40 |
Seat distribution by constituency
| Constituency | PO | PiS | LiD | PSL | MN | Sum |
|---|---|---|---|---|---|---|
| 1 – Legnica | 6 | 4 | 2 | - | - | 12 |
| 2 – Wałbrzych | 5 | 2 | 1 | - | - | 8 |
| 3 – Wrocław | 9 | 4 | 1 | - | - | 14 |
| 4 – Bydgoszcz | 6 | 3 | 2 | 1 | - | 12 |
| 5 – Toruń | 6 | 4 | 2 | 1 | - | 13 |
| 6 – Lublin | 5 | 7 | 1 | 2 | - | 15 |
| 7 – Chełm | 3 | 6 | 1 | 2 | - | 12 |
| 8 – Zielona Góra | 6 | 3 | 2 | 1 | - | 12 |
| 9 – Łódź | 5 | 3 | 2 | - | - | 10 |
| 10 – Piotrków Trybunalski | 3 | 4 | 1 | 1 | - | 9 |
| 11 – Sieradz | 4 | 5 | 1 | 2 | - | 12 |
| 12 – Chrzanów | 3 | 4 | 1 | - | - | 8 |
| 13 – Kraków | 7 | 5 | 1 | - | - | 13 |
| 14 – Nowy Sącz | 3 | 5 | - | 1 | - | 9 |
| 15 – Tarnów | 3 | 5 | - | 1 | - | 9 |
| 16 – Płock | 3 | 4 | 1 | 2 | - | 10 |
| 17 – Radom | 3 | 4 | 1 | 1 | - | 9 |
| 18 – Siedlce | 3 | 6 | 1 | 2 | - | 12 |
| 19 – Warsaw I | 11 | 6 | 2 | - | - | 19 |
| 20 – Warsaw II | 5 | 4 | 1 | 1 | - | 11 |
| 21 – Opole | 7 | 3 | 1 | 1 | 1 | 13 |
| 22 – Krosno | 3 | 6 | 1 | 1 | - | 11 |
| 23 – Rzeszów | 4 | 8 | 1 | 2 | - | 15 |
| 24 – Białystok | 5 | 7 | 2 | 1 | - | 15 |
| 25 – Gdańsk | 8 | 3 | 1 | - | - | 12 |
| 26 – Gdynia | 8 | 4 | 2 | - | - | 14 |
| 27 – Bielsko-Biała | 4 | 4 | 1 | - | - | 9 |
| 28 – Częstochowa | 3 | 3 | 1 | - | - | 7 |
| 29 – Gliwice | 6 | 3 | 1 | - | - | 10 |
| 30 – Rybnik | 4 | 4 | 1 | - | - | 9 |
| 31 – Katowice | 7 | 4 | 1 | - | - | 12 |
| 32 – Sosnowiec | 5 | 2 | 2 | - | - | 9 |
| 33 – Kielce | 5 | 7 | 2 | 2 | - | 16 |
| 34 – Elbląg | 4 | 2 | 1 | 1 | - | 8 |
| 35 – Olsztyn | 5 | 3 | 1 | 1 | - | 10 |
| 36 – Kalisz | 5 | 3 | 2 | 2 | - | 11 |
| 37 – Konin | 3 | 3 | 2 | 1 | - | 9 |
| 38 – Piła | 4 | 2 | 2 | 1 | - | 9 |
| 39 – Poznań | 7 | 2 | 1 | - | 10 | |
| 40 – Koszalin | 5 | 2 | 1 | - | - | 8 |
| 41 – Szczecin | 8 | 3 | 2 | - | - | 13 |
| Total | 209 | 166 | 53 | 31 | 1 | 460 |
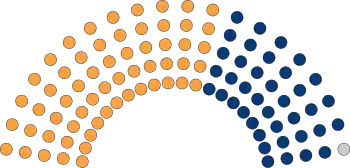
Senate
 | |||||
|---|---|---|---|---|---|
| Party | Votes | % | Seats | +/– | |
| Civic Platform | 12,734,742 | 39.14 | 60 | +26 | |
| Law and Justice | 10,208,412 | 31.38 | 39 | –10 | |
| Left and Democrats | 4,751,281 | 14.60 | 0 | 0 | |
| Polish People's Party | 2,863,883 | 8.80 | 0 | –2 | |
| Self-Defence of the Republic of Poland | 345,427 | 1.06 | 0 | –3 | |
| League of Polish Families | 293,289 | 0.90 | 0 | –7 | |
| German Minority Electoral Committee | 104,533 | 0.32 | 0 | 0 | |
| Patriotic Self-Defense | 48,689 | 0.15 | 0 | New | |
| Local lists and independents | 1,185,400 | 3.64 | 1 | –4 | |
| Total | 32,535,656 | 100.00 | 100 | 0 | |
| Valid votes | 16,190,804 | 98.27 | |||
| Invalid/blank votes | 284,868 | 1.73 | |||
| Total votes | 16,475,672 | 100.00 | |||
| Registered voters/turnout | 30,615,471 | 53.81 | |||
| Source: Nohlen & Stöver | |||||
By constituency
| No. | Constituency | Total seats | Seats won | ||
|---|---|---|---|---|---|
| PO | PiS | Others | |||
| 1 | Legnica | 3 | 2 | 1 | |
| 2 | Wałbrzych | 2 | 2 | ||
| 3 | Wrocław | 3 | 3 | ||
| 4 | Bydgoszcz | 2 | 2 | ||
| 5 | Toruń | 3 | 3 | ||
| 6 | Lublin | 3 | 3 | ||
| 7 | Chełm | 3 | 1 | 2 | |
| 8 | Zielona Góra | 3 | 2 | 1 | |
| 9 | Łódź | 2 | 2 | ||
| 10 | Piotrków Trybunalski | 2 | 2 | ||
| 11 | Sieradz | 3 | 2 | 1 | |
| 12 | Kraków | 4 | 3 | 1 | |
| 13 | Nowy Sącz | 2 | 2 | ||
| 14 | Tarnów | 2 | 2 | ||
| 15 | Płock | 2 | 1 | 1 | |
| 16 | Radom | 2 | 2 | ||
| 17 | Siedlce | 3 | 3 | ||
| 18 | Warsaw | 4 | 3 | 1 | |
| 19 | Warsaw | 2 | 1 | 1 | |
| 20 | Opole | 3 | 2 | 1 | |
| 21 | Krosno | 2 | 2 | ||
| 22 | Rzeszów | 3 | 3 | ||
| 23 | Białystok | 3 | 2 | 1 | |
| 24 | Gdańsk | 3 | 3 | ||
| 25 | Gydnia | 3 | 2 | 1 | |
| 26 | Bielsko-Biała | 2 | 2 | ||
| 27 | Częstochowa | 2 | 1 | 1 | |
| 28 | Gliwice | 2 | 2 | ||
| 29 | Rybnik | 2 | 1 | 1 | |
| 30 | Katowice | 3 | 2 | 1 | |
| 31 | Sosnowiec | 2 | 2 | ||
| 32 | Kielce | 3 | 1 | 2 | |
| 33 | Elbląg | 2 | 1 | 1 | |
| 34 | Olsztyn | 2 | 2 | ||
| 35 | Kalisz | 3 | 2 | 1 | |
| 36 | Konin | 2 | 2 | ||
| 37 | Piła | 2 | 2 | ||
| 38 | Poznań | 2 | 2 | ||
| 39 | Koszalin | 2 | 2 | ||
| 40 | Szczecin | 2 | 2 | ||
| Total | 100 | 60 | 39 | 1 | |
Aftermath
Consecutive postponements of the electoral silence's termination (initially planned for 8 PM) by the National Electoral Committee was widely criticized. The Organization for Security and Co-operation in Europe Election Assessment Mission stated that the elections demonstrate a democratic and pluralistic process, but challenges remain in oversight of the public media.[6]
Prime Minister and PiS leader Jarosław Kaczyński stepped down from office on 15 November, and PO leader, Donald Tusk, was sworn in as Poland's Prime Minister the following day. The Civic Platform formed a coalition majority government with the agrarian centrist Polish People's Party.
References
- 1 2 3 4 "Sejm parliamentary groups". Sejm.gov.pl. Retrieved 10 February 2015.
- ↑ Dieter Nohlen & Philip Stöver (2010) Elections in Europe: A data handbook, p1491 ISBN 978-3-8329-5609-7
- ↑ "Polish MPs choose early election". BBC News. 2007-09-07. Retrieved 2012-05-17.
- ↑ "Krajowa Partia Emerytów i Rencistów nie startuje w wyborach". TVN24.pl. 2007-09-26. Retrieved 2010-06-21.
- ↑ "Elections 2007". Wybory2007.pkw.gov.pl. Retrieved 2010-06-21.
- ↑ "Office for Democratic Institutions and Human Rights - Office for Democratic Institutions and Human Rights - Elections - Polish elections demonstrate a democratic and pluralistic process, but challenges remain in oversight of the public media, OSCE finds". Organization for Security and Co-operation in Europe. Archived from the original on 2007-08-08. Retrieved 2010-06-21.
External links
- 2007 election National Election Commission
- Electoral leaflets and posters Tractotheque
_(cropped).jpg.webp)
.JPG.webp)
.jpg.webp)
