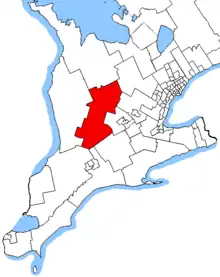
 Perth—Wellington in relation to other southern Ontario ridings | |||
| Provincial electoral district | |||
| Legislature | Legislative Assembly of Ontario | ||
| MPP |
Progressive Conservative | ||
| District created | 2006 | ||
| First contested | 2007 | ||
| Last contested | 2022 | ||
| Demographics | |||
| Population (2016) | 107,905 | ||
| Electors (2018) | 78,738 | ||
| Area (km²) | 3,615 | ||
| Pop. density (per km²) | 29.8 | ||
| Census division(s) | Perth, Wellington | ||
| Census subdivision(s) | Minto, Wellington North, North Perth, Mapleton, West Perth, Perth East, Stratford, Perth South, St. Marys | ||
Perth—Wellington is a provincial electoral district in Ontario, Canada, that has been represented in the Legislative Assembly of Ontario since the 2007 provincial election.
It was created in 2003 from parts of Dufferin—Peel—Wellington—Grey, Perth—Middlesex and Waterloo—Wellington ridings.
It consists of the County of Perth, and the Town of Minto and the townships of Mapleton and Wellington North in the County of Wellington.[1]
Members of Provincial Parliament
| Perth—Wellington | ||||
|---|---|---|---|---|
| Assembly | Years | Member | Party | |
| Riding created from Dufferin—Peel—Wellington—Grey, Perth—Middlesex and Waterloo—Wellington | ||||
| 39th | 2007–2011 | John Wilkinson | Liberal | |
| 40th | 2011–2014 | Randy Pettapiece | Progressive Conservative | |
| 41st | 2014–2018 | |||
| 42nd | 2018–2022 | |||
| 43rd | 2022–present | Matthew Rae | ||
Election results
| 2022 Ontario general election | ||||||||
|---|---|---|---|---|---|---|---|---|
| Party | Candidate | Votes | % | ±% | ||||
| Progressive Conservative | Matthew Rae | 19,443 | 46.86 | |||||
| New Democratic | Jo-Dee Burbach | 9,143 | 22.03 | |||||
| Liberal | Ashley Fox | 6,676 | 16.09 | |||||
| Green | Laura Bisutti | 2,619 | 6.31 | |||||
| New Blue | Bob Hosken | 2,453 | 5.91 | |||||
| Ontario Party | Sandy William MacGregor | 981 | 2.36 | |||||
| Freedom | Robby Smink | 181 | 0.44 | |||||
| Total valid votes | ||||||||
| Total rejected, unmarked and declined ballots | ||||||||
| Turnout | 49.86 | |||||||
| Eligible voters | 83,232 | |||||||
| Source: Elections Ontario[2] | ||||||||
| 2018 Ontario general election | ||||||||
|---|---|---|---|---|---|---|---|---|
| Party | Candidate | Votes | % | ±% | ||||
| Progressive Conservative | Randy Pettapiece | 23,736 | 50.67 | +11.71 | ||||
| New Democratic | Michael O'Brien | 14,385 | 30.71 | +11.79 | ||||
| Liberal | Brendan Knight | 5,062 | 10.81 | -22.29 | ||||
| Green | Lisa Olsen | 2,746 | 5.86 | +0.98 | ||||
| Libertarian | Scott Marshall | 380 | 0.81 | -0.19 | ||||
| Consensus Ontario | Paul McKendrick | 320 | 0.68 | n/a | ||||
| Freedom | Rob Smeenk | 125 | 0.27 | -0.23 | ||||
| Alliance | Andrew Stanton | 89 | 0.19 | n/a | ||||
| Total valid votes | 46,843 | 98.58 | ||||||
| Total rejected, unmarked and declined ballots | 673 | 1.42 | -0.14 | |||||
| Turnout | 47,516 | 60.35 | +4.69 | |||||
| Eligible voters | 78,738 | |||||||
| Progressive Conservative hold | Swing | -0.04 | ||||||
| Source: Elections Ontario[3] | ||||||||
| 2014 Ontario general election | ||||||||
|---|---|---|---|---|---|---|---|---|
| Party | Candidate | Votes | % | ±% | ||||
| Progressive Conservative | Randy Pettapiece | 15,992 | 38.96 | -1.13 | ||||
| Liberal | Stewart Skinner | 13,585 | 33.10 | -6.43 | ||||
| New Democratic | Romayne Smith Fullerton | 7,764 | 18.91 | +3.14 | ||||
| Green | Chris Desjardins | 2,005 | 4.88 | +2.40 | ||||
| Family Coalition | Irma DeVries | 746 | 1.82 | +0.13 | ||||
| Libertarian | Scott Marshall | 411 | 1.00 | |||||
| Independent | Matthew Murphy | 343 | 0.84 | |||||
| Freedom | Robby Smink | 202 | 0.49 | +0.05 | ||||
| Total valid votes | 41,048 | 98.44 | ||||||
| Total rejected, unmarked and declined ballots | 650 | 1.56 | ||||||
| Turnout | 41,698 | 55.66 | ||||||
| Eligible voters | 74,914 | |||||||
| Progressive Conservative hold | Swing | +2.75 | ||||||
| Source: Elections Ontario[4] | ||||||||
| 2011 Ontario general election | ||||||||
|---|---|---|---|---|---|---|---|---|
| Party | Candidate | Votes | % | ±% | ||||
| Progressive Conservative | Randy Pettapiece | 14,845 | 40.09 | +8.05 | ||||
| Liberal | John Wilkinson | 14,635 | 39.53 | -7.65 | ||||
| New Democratic | Ellen Papenburg | 5,836 | 15.76 | +5.62 | ||||
| Green | Chris Desjardins | 918 | 2.48 | -5.27 | ||||
| Family Coalition | Irma DeVries | 627 | 1.69 | -0.27 | ||||
| Freedom | Robby Smink | 164 | 0.44 | +0.07 | ||||
| Total valid votes | 37,025 | 100.0 | ||||||
| Total rejected, unmarked and declined ballots | 144 | 0.39 | ||||||
| Turnout | 37,169 | 51.89 | ||||||
| Eligible voters | 71,629 | |||||||
| Progressive Conservative gain from Liberal | Swing | +7.85 | ||||||
| Source: Elections Ontario[5] | ||||||||
| 2007 Ontario general election | ||||||||
|---|---|---|---|---|---|---|---|---|
| Party | Candidate | Votes | % | |||||
| Liberal | John Wilkinson | 18,249 | 47.18 | |||||
| Progressive Conservative | John Rutherford | 12,391 | 32.04 | |||||
| New Democratic | Donna Hansen | 3,922 | 10.14 | |||||
| Green | Anita Payne | 2,997 | 7.75 | |||||
| Family Coalition | Pat Bannon | 760 | 1.96 | |||||
| Independent | Kevin Allman | 216 | 0.56 | |||||
| Freedom | Robby Smink | 143 | 0.37 | |||||
| Total valid votes | 38,678 | 100.0 | ||||||
2007 electoral reform referendum
| 2007 Ontario electoral reform referendum | |||
|---|---|---|---|
| Side | Votes | % | |
| First Past the Post | 25,480 | 67.6 | |
| Mixed member proportional | 12,218 | 32.4 | |
| Total valid votes | 37,698 | 100.0 | |
Sources
- ↑ "Perth-Wellington". www.elections.on.ca. Retrieved 2015-08-17.
- ↑ "Candidates in: Perth—Wellington (085)". Elections Ontario. Retrieved June 2, 2022.
- ↑ "Summary of Valid Votes Cast for each Candidate" (PDF). Elections Ontario. p. 8. Retrieved 20 January 2019.
- ↑ Elections Ontario. "General Election Results by District, 070 Perth-Wellington". Archived from the original on 14 June 2014. Retrieved 13 June 2014.
- ↑ Elections Ontario (2011). "Official return from the records / Rapport des registres officiels - Perth—Wellington" (PDF). Retrieved 2 June 2014.
This article is issued from Wikipedia. The text is licensed under Creative Commons - Attribution - Sharealike. Additional terms may apply for the media files.