Medirigiriya | |
|---|---|
 | |
| Coordinates: 8°07′43″N 81°02′02″E / 8.128672°N 81.033933°E | |
| Country | Sri Lanka |
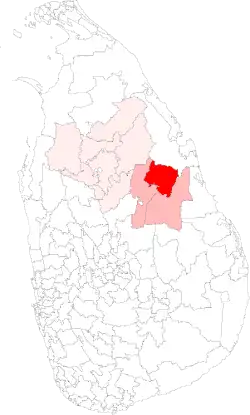
| Province | North Central Province, Sri Lanka |
| Electoral District | Polonnaruwa Electoral District |
| Area | |
| • Total | 740.87 km2 (286.05 sq mi) |
| Population (2012)[1] | |
| • Total | 102,027 |
| • Density | 138/km2 (360/sq mi) |
| ISO 3166 code | EC-18B |
The Medirigiriya Polling Division is a Polling Division in the Polonnaruwa Electoral District, in the North Central Province, Sri Lanka.
Presidential Election Results
Summary
The winner of Medirigiriya has matched the final country result 8 out of 8 times. Hence, Medirigiriya is a Perfect Bellwether for Presidential Elections.
| Year | Medirigiriya | Polonnaruwa Electoral District | MAE[2] % | Sri Lanka | MAE[3] % | |||
|---|---|---|---|---|---|---|---|---|
| 2019 | SLPP | SLPP | 1.80% | SLPP | 0.81% | |||
| 2015 | NDF | NDF | 3.92% | NDF | 2.43% | |||
| 2010 | UPFA | UPFA | 1.21% | UPFA | 5.48% | |||
| 2005 | UPFA | UPFA | 1.57% | UPFA | 0.65% | |||
| 1999 | PA | PA | 1.27% | PA | 0.82% | |||
| 1994 | PA | PA | 2.22% | PA | 5.46% | |||
| 1988 | UNP | UNP | 8.42% | UNP | 12.01% | |||
| 1982 | UNP | UNP | 1.58% | UNP | 5.05% | |||
| Matches/Mean MAE | 8/8 | 8/8 | 2.75% | 8/8 | 4.09% | |||
2019 Sri Lankan Presidential Election
| Party | Medirigiriya[4] | Polonnaruwa Electoral District | Sri Lanka | |||||||
|---|---|---|---|---|---|---|---|---|---|---|
| Votes | % | Votes | % | Votes | % | |||||
| SLPP | 34,022 | 51.44% | 147,340 | 53.01% | 6,924,255 | 52.25% | ||||
| NDF | 28,324 | 42.82% | 112,473 | 40.47% | 5,564,239 | 41.99% | ||||
| NMPP | 2,734 | 4.13% | 12,284 | 4.42% | 418,553 | 3.16% | ||||
| Other Parties (with < 1%) | 1,064 | 1.61% | 5,827 | 2.10% | 345,452 | 2.61% | ||||
| Valid Votes | 66,144 | 99.37% | 277,924 | 99.09% | 13,252,499 | 98.99% | ||||
| Rejected Votes | 417 | 0.63% | 2,563 | 0.91% | 135,452 | 1.01% | ||||
| Total Polled | 66,561 | 85.89% | 280,487 | 85.92% | 13,387,951 | 83.71% | ||||
| Registered Electors | 77,499 | 326,443 | 15,992,568 | |||||||
2015 Sri Lankan Presidential Election
| Party | Medirigiriya[5] | Polonnaruwa Electoral District | Sri Lanka | |||||||
|---|---|---|---|---|---|---|---|---|---|---|
| Votes | % | Votes | % | Votes | % | |||||
| NDF | 32,875 | 53.89% | 147,974 | 57.80% | 6,217,162 | 51.28% | ||||
| UPFA | 27,623 | 45.28% | 105,640 | 41.27% | 5,768,090 | 47.58% | ||||
| Other Parties (with < 1%) | 509 | 0.83% | 2,382 | 0.93% | 138,200 | 1.14% | ||||
| Valid Votes | 61,007 | 99.50% | 255,996 | 99.31% | 12,123,452 | 98.85% | ||||
| Rejected Votes | 307 | 0.50% | 1,790 | 0.69% | 140,925 | 1.15% | ||||
| Total Polled | 61,314 | 79.11% | 257,786 | 80.22% | 12,264,377 | 78.69% | ||||
| Registered Electors | 77,505 | 321,338 | 15,585,942 | |||||||
2010 Sri Lankan Presidential Election
| Party | Medirigiriya[6] | Polonnaruwa Electoral District | Sri Lanka | |||||||
|---|---|---|---|---|---|---|---|---|---|---|
| Votes | % | Votes | % | Votes | % | |||||
| UPFA | 34,613 | 63.74% | 144,889 | 64.92% | 6,015,934 | 57.88% | ||||
| NDF | 18,979 | 34.95% | 75,026 | 33.62% | 4,173,185 | 40.15% | ||||
| Other Parties (with < 1%) | 710 | 1.31% | 3,260 | 1.46% | 204,494 | 1.97% | ||||
| Valid Votes | 54,302 | 99.49% | 223,175 | 99.34% | 10,393,613 | 99.03% | ||||
| Rejected Votes | 281 | 0.51% | 1,472 | 0.66% | 101,838 | 0.97% | ||||
| Total Polled | 54,583 | 75.39% | 224,647 | 76.26% | 10,495,451 | 66.70% | ||||
| Registered Electors | 72,402 | 294,583 | 15,734,587 | |||||||
2005 Sri Lankan Presidential Election
| Party | Medirigiriya[7] | Polonnaruwa Electoral District | Sri Lanka | |||||||
|---|---|---|---|---|---|---|---|---|---|---|
| Votes | % | Votes | % | Votes | % | |||||
| UPFA | 27,230 | 51.00% | 110,499 | 52.61% | 4,887,152 | 50.29% | ||||
| UNP | 25,533 | 47.83% | 97,142 | 46.25% | 4,706,366 | 48.43% | ||||
| Other Parties (with < 1%) | 625 | 1.17% | 2,389 | 1.14% | 123,521 | 1.27% | ||||
| Valid Votes | 53,388 | 99.25% | 210,030 | 99.06% | 9,717,039 | 98.88% | ||||
| Rejected Votes | 402 | 0.75% | 2,002 | 0.94% | 109,869 | 1.12% | ||||
| Total Polled | 53,790 | 77.70% | 212,032 | 78.07% | 9,826,908 | 69.51% | ||||
| Registered Electors | 69,230 | 271,609 | 14,136,979 | |||||||
1999 Sri Lankan Presidential Election
| Party | Medirigiriya[8] | Polonnaruwa Electoral District | Sri Lanka | |||||||
|---|---|---|---|---|---|---|---|---|---|---|
| Votes | % | Votes | % | Votes | % | |||||
| PA | 23,395 | 50.72% | 88,663 | 51.55% | 4,312,157 | 51.12% | ||||
| UNP | 20,345 | 44.10% | 72,598 | 42.21% | 3,602,748 | 42.71% | ||||
| JVP | 1,709 | 3.70% | 8,020 | 4.66% | 343,927 | 4.08% | ||||
| Other Parties (with < 1%) | 680 | 1.47% | 2,726 | 1.58% | 176,679 | 2.09% | ||||
| Valid Votes | 46,129 | 98.43% | 172,007 | 98.20% | 8,435,754 | 97.69% | ||||
| Rejected Votes | 736 | 1.57% | 3,151 | 1.80% | 199,536 | 2.31% | ||||
| Total Polled | 46,865 | 77.89% | 175,158 | 78.11% | 8,635,290 | 72.17% | ||||
| Registered Electors | 60,171 | 224,239 | 11,965,536 | |||||||
1994 Sri Lankan Presidential Election
| Party | Medirigiriya[9] | Polonnaruwa Electoral District | Sri Lanka | |||||||
|---|---|---|---|---|---|---|---|---|---|---|
| Votes | % | Votes | % | Votes | % | |||||
| PA | 23,977 | 56.86% | 88,907 | 59.08% | 4,709,205 | 62.28% | ||||
| UNP | 17,588 | 41.71% | 59,287 | 39.40% | 2,715,283 | 35.91% | ||||
| Other Parties (with < 1%) | 603 | 1.43% | 2,281 | 1.52% | 137,040 | 1.81% | ||||
| Valid Votes | 42,168 | 97.76% | 150,475 | 97.43% | 7,561,526 | 98.03% | ||||
| Rejected Votes | 965 | 2.24% | 3,966 | 2.57% | 151,706 | 1.97% | ||||
| Total Polled | 43,133 | 78.05% | 154,441 | 75.73% | 7,713,232 | 69.12% | ||||
| Registered Electors | 55,264 | 203,940 | 11,158,880 | |||||||
1988 Sri Lankan Presidential Election
| Party | Medirigiriya[10] | Polonnaruwa Electoral District | Sri Lanka | |||||||
|---|---|---|---|---|---|---|---|---|---|---|
| Votes | % | Votes | % | Votes | % | |||||
| UNP | 6,592 | 64.31% | 26,392 | 55.54% | 2,569,199 | 50.43% | ||||
| SLFP | 3,497 | 34.12% | 20,173 | 42.45% | 2,289,857 | 44.95% | ||||
| SLMP | 161 | 1.57% | 957 | 2.01% | 235,701 | 4.63% | ||||
| Valid Votes | 10,250 | 95.81% | 47,522 | 97.62% | 5,094,754 | 98.24% | ||||
| Rejected Votes | 448 | 4.19% | 1,157 | 2.38% | 91,499 | 1.76% | ||||
| Total Polled | 10,698 | 21.95% | 48,679 | 29.64% | 5,186,256 | 55.87% | ||||
| Registered Electors | 48,728 | 164,213 | 9,283,143 | |||||||
1982 Sri Lankan Presidential Election
| Party | Medirigiriya[11] | Polonnaruwa Electoral District | Sri Lanka | |||||||
|---|---|---|---|---|---|---|---|---|---|---|
| Votes | % | Votes | % | Votes | % | |||||
| UNP | 20,324 | 58.03% | 59,414 | 56.26% | 3,450,815 | 52.93% | ||||
| SLFP | 11,777 | 33.63% | 37,243 | 35.26% | 2,546,348 | 39.05% | ||||
| JVP | 2,736 | 7.81% | 8,138 | 7.71% | 273,428 | 4.19% | ||||
| Other Parties (with < 1%) | 186 | 0.53% | 820 | 0.78% | 249,460 | 3.83% | ||||
| Valid Votes | 35,023 | 99.12% | 105,615 | 99.00% | 6,520,156 | 98.78% | ||||
| Rejected Votes | 312 | 0.88% | 1,064 | 1.00% | 80,470 | 1.22% | ||||
| Total Polled | 35,335 | 81.72% | 106,679 | 82.81% | 6,600,626 | 80.15% | ||||
| Registered Electors | 43,240 | 128,822 | 8,235,358 | |||||||
Parliamentary Election Results
Summary
The winner of Medirigiriya has matched the final country result 6 out of 7 times. Hence, Medirigiriya is a Strong Bellwether for Parliamentary Elections.
| Year | Medirigiriya | Polonnaruwa Electoral District | MAE[12] % | Sri Lanka | MAE[13] % | |||
|---|---|---|---|---|---|---|---|---|
| 2015 | UNP | UNP | 0.54% | UNP | 3.02% | |||
| 2010 | UPFA | UPFA | 3.50% | UPFA | 3.90% | |||
| 2004 | UPFA | UPFA | 2.27% | UPFA | 6.83% | |||
| 2001 | UNP | UNP | 1.85% | UNP | 3.07% | |||
| 2000 | UNP | UNP | 0.62% | PA | 3.19% | |||
| 1994 | PA | PA | 1.73% | PA | 2.83% | |||
| 1989 | UNP | UNP | 7.07% | UNP | 11.47% | |||
| Matches/Mean MAE | 6/7 | 6/7 | 2.51% | 7/7 | 4.90% | |||
2015 Sri Lankan Parliamentary Election
| Party | Medirigiriya[14] | Polonnaruwa Electoral District | Sri Lanka | |||||||
|---|---|---|---|---|---|---|---|---|---|---|
| Votes | % | Votes | % | Votes | % | |||||
| UNP | 28,256 | 50.26% | 118,845 | 50.30% | 5,098,916 | 45.77% | ||||
| UPFA | 25,151 | 44.74% | 103,172 | 43.67% | 4,732,664 | 42.48% | ||||
| JVP | 2,647 | 4.71% | 13,497 | 5.71% | 544,154 | 4.88% | ||||
| Other Parties (with < 1%) | 162 | 0.29% | 765 | 0.32% | 44,633 | 0.40% | ||||
| Valid Votes | 56,216 | 96.63% | 236,279 | 96.39% | 11,140,333 | 95.35% | ||||
| Rejected Votes | 1,919 | 3.30% | 8,654 | 3.53% | 516,926 | 4.42% | ||||
| Total Polled | 58,176 | 75.06% | 245,116 | 79.81% | 11,684,111 | 77.66% | ||||
| Registered Electors | 77,505 | 307,125 | 15,044,490 | |||||||
2010 Sri Lankan Parliamentary Election
| Party | Medirigiriya[15] | Polonnaruwa Electoral District | Sri Lanka | |||||||
|---|---|---|---|---|---|---|---|---|---|---|
| Votes | % | Votes | % | Votes | % | |||||
| UPFA | 26,794 | 65.86% | 118,694 | 69.25% | 4,846,388 | 60.38% | ||||
| UNP | 12,572 | 30.90% | 45,732 | 26.68% | 2,357,057 | 29.37% | ||||
| DNA | 1,199 | 2.95% | 6,457 | 3.77% | 441,251 | 5.50% | ||||
| Other Parties (with < 1%) | 116 | 0.29% | 515 | 0.30% | 53,515 | 0.67% | ||||
| Valid Votes | 40,681 | 91.80% | 171,398 | 92.02% | 8,026,322 | 96.03% | ||||
| Rejected Votes | 3,613 | 8.15% | 14,798 | 7.94% | 581,465 | 6.96% | ||||
| Total Polled | 44,313 | 61.20% | 186,269 | 63.10% | 8,358,246 | 59.29% | ||||
| Registered Electors | 72,402 | 295,186 | 14,097,690 | |||||||
2004 Sri Lankan Parliamentary Election
| Party | Medirigiriya[16] | Polonnaruwa Electoral District | Sri Lanka | |||||||
|---|---|---|---|---|---|---|---|---|---|---|
| Votes | % | Votes | % | Votes | % | |||||
| UPFA | 26,114 | 55.26% | 106,243 | 57.36% | 4,223,126 | 45.70% | ||||
| UNP | 20,522 | 43.42% | 75,664 | 40.85% | 3,486,792 | 37.73% | ||||
| Other Parties (with < 1%) | 624 | 1.32% | 3,303 | 1.78% | 607,063 | 6.57% | ||||
| Valid Votes | 47,260 | 93.94% | 185,210 | 93.57% | 9,241,931 | 94.52% | ||||
| Rejected Votes | 3,035 | 6.03% | 12,673 | 6.40% | 534,452 | 5.47% | ||||
| Total Polled | 50,311 | 75.54% | 197,934 | 77.91% | 9,777,821 | 75.74% | ||||
| Registered Electors | 66,605 | 254,061 | 12,909,631 | |||||||
2001 Sri Lankan Parliamentary Election
| Party | Medirigiriya[17] | Polonnaruwa Electoral District | Sri Lanka | |||||||
|---|---|---|---|---|---|---|---|---|---|---|
| Votes | % | Votes | % | Votes | % | |||||
| UNP | 24,450 | 50.44% | 86,786 | 47.82% | 4,086,026 | 45.62% | ||||
| PA | 19,149 | 39.50% | 73,679 | 40.60% | 3,330,815 | 37.19% | ||||
| JVP | 4,355 | 8.98% | 18,956 | 10.44% | 815,353 | 9.10% | ||||
| Other Parties (with < 1%) | 524 | 1.08% | 2,076 | 1.14% | 118,404 | 1.32% | ||||
| Valid Votes | 48,478 | 95.28% | 181,497 | 93.87% | 8,955,844 | 94.77% | ||||
| Rejected Votes | 2,401 | 4.72% | 11,854 | 6.13% | 494,009 | 5.23% | ||||
| Total Polled | 50,879 | 80.10% | 193,351 | 80.41% | 9,449,878 | 76.03% | ||||
| Registered Electors | 63,518 | 240,444 | 12,428,762 | |||||||
2000 Sri Lankan Parliamentary Election
| Party | Medirigiriya[18] | Polonnaruwa Electoral District | Sri Lanka | |||||||
|---|---|---|---|---|---|---|---|---|---|---|
| Votes | % | Votes | % | Votes | % | |||||
| UNP | 22,213 | 47.30% | 82,399 | 46.33% | 3,451,765 | 40.12% | ||||
| PA | 21,075 | 44.88% | 80,023 | 44.99% | 3,899,329 | 45.33% | ||||
| JVP | 2,135 | 4.55% | 11,161 | 6.27% | 518,725 | 6.03% | ||||
| NUA | 1,048 | 2.23% | 1,977 | 1.11% | 185,593 | 2.16% | ||||
| Other Parties (with < 1%) | 486 | 1.03% | 2,311 | 1.30% | 239,322 | 2.78% | ||||
| Valid Votes | 46,957 | N/A | 177,871 | N/A | 8,602,617 | N/A | ||||
1994 Sri Lankan Parliamentary Election
| Party | Medirigiriya[19] | Polonnaruwa Electoral District | Sri Lanka | |||||||
|---|---|---|---|---|---|---|---|---|---|---|
| Votes | % | Votes | % | Votes | % | |||||
| PA | 22,287 | 49.69% | 82,438 | 51.18% | 3,887,805 | 48.94% | ||||
| UNP | 22,261 | 49.63% | 76,706 | 47.62% | 3,498,370 | 44.04% | ||||
| Other Parties (with < 1%) | 308 | 0.69% | 1,934 | 1.20% | 90,078 | 1.13% | ||||
| Valid Votes | 44,856 | 96.50% | 161,078 | 96.16% | 7,943,688 | 95.20% | ||||
| Rejected Votes | 1,626 | 3.50% | 6,434 | 3.84% | 400,395 | 4.80% | ||||
| Total Polled | 46,482 | 84.11% | 167,512 | 82.06% | 8,344,095 | 74.75% | ||||
| Registered Electors | 55,264 | 204,138 | 11,163,064 | |||||||
1989 Sri Lankan Parliamentary Election
| Party | Medirigiriya[20] | Polonnaruwa Electoral District | Sri Lanka | |||||||
|---|---|---|---|---|---|---|---|---|---|---|
| Votes | % | Votes | % | Votes | % | |||||
| UNP | 8,631 | 70.57% | 43,473 | 62.33% | 2,838,005 | 50.71% | ||||
| SLFP | 3,384 | 27.67% | 23,221 | 33.29% | 1,785,369 | 31.90% | ||||
| ELJP | 148 | 1.21% | 1,933 | 2.77% | 67,723 | 1.21% | ||||
| Other Parties (with < 1%) | 67 | 0.55% | 1,117 | 1.60% | 141,983 | 2.54% | ||||
| Valid Votes | 12,230 | 92.73% | 69,744 | 92.98% | 5,596,468 | 93.87% | ||||
| Rejected Votes | 959 | 7.27% | 5,266 | 7.02% | 365,563 | 6.13% | ||||
| Total Polled | 13,189 | 27.21% | 75,010 | 45.81% | 5,962,031 | 63.60% | ||||
| Registered Electors | 48,477 | 163,745 | 9,374,164 | |||||||
Demographics
Ethnicity
The Medirigiriya Polling Division has a Sinhalese majority (88.6%) and a significant Moor population (11.3%) . In comparison, the Polonnaruwa Electoral District (which contains the Medirigiriya Polling Division) has a Sinhalese majority (90.7%) [1]
Religion
The Medirigiriya Polling Division has a Buddhist majority (88.1%) and a significant Muslim population (11.3%) . In comparison, the Polonnaruwa Electoral District (which contains the Medirigiriya Polling Division) has a Buddhist majority (89.7%) [1]
References
- 1 2 3 4 5 "Census of Population and Housing 2012". statistics.gov.lk. Department of Census and Statistics, Sri Lanka. 2012.
- ↑ The mean absolute error, between the percentages of votes each party got in Medirigiriya and the Polonnaruwa Electoral District. It is a measure of the difference in voting behaviour between the two regions.
- ↑ The mean absolute error, between the percentages of votes each party got in Medirigiriya and the country. It is a measure of the difference in voting behaviour between the two regions.
- ↑ "2019 Sri Lankan presidential election Results". elections.gov.lk. Election Commission of Sri Lanka. 2019.
- ↑ "2015 Sri Lankan presidential election Results". elections.gov.lk. Election Commission of Sri Lanka. 2015.
- ↑ "2010 Sri Lankan presidential election Results". elections.gov.lk. Election Commission of Sri Lanka. 2010.
- ↑ "2005 Sri Lankan presidential election Results". elections.gov.lk. Election Commission of Sri Lanka. 2005.
- ↑ "1999 Sri Lankan presidential election Results". elections.gov.lk. Election Commission of Sri Lanka. 1999.
- ↑ "1994 Sri Lankan presidential election Results". elections.gov.lk. Election Commission of Sri Lanka. 1994.
- ↑ "1988 Sri Lankan presidential election Results". elections.gov.lk. Election Commission of Sri Lanka. 1988.
- ↑ "1982 Sri Lankan presidential election Results". elections.gov.lk. Election Commission of Sri Lanka. 1982.
- ↑ The mean absolute error, between the percentages of votes each party got in Medirigiriya and the Polonnaruwa Electoral District. It is a measure of the difference in voting behaviour between the two regions.
- ↑ The mean absolute error, between the percentages of votes each party got in Medirigiriya and the country. It is a measure of the difference in voting behaviour between the two regions.
- ↑ "2015 Sri Lankan parliamentary election Results" (PDF). elections.gov.lk. Election Commission of Sri Lanka. 2015.
- ↑ "2010 Sri Lankan parliamentary election Results" (PDF). elections.gov.lk. Election Commission of Sri Lanka. 2010.
- ↑ "2004 Sri Lankan parliamentary election Results" (PDF). elections.gov.lk. Election Commission of Sri Lanka. 2004.
- ↑ "2001 Sri Lankan parliamentary election Results" (PDF). elections.gov.lk. Election Commission of Sri Lanka. 2001.
- ↑ "2000 Sri Lankan parliamentary election Results" (PDF). elections.gov.lk. Election Commission of Sri Lanka. 2000.
- ↑ "1994 Sri Lankan parliamentary election Results" (PDF). elections.gov.lk. Election Commission of Sri Lanka. 1994.
- ↑ "1989 Sri Lankan parliamentary election Results" (PDF). elections.gov.lk. Election Commission of Sri Lanka. 1989.