| Lanark | |
|---|---|
| Former County constituency for the House of Commons | |
| 1918–1983 | |
| Seats | One |
| Created from | South Lanarkshire and Mid Lanarkshire |
| Replaced by | Clydesdale, Motherwell North and Motherwell South[1] |
Lanark was a county constituency of the House of Commons of the Parliament of the United Kingdom (Westminster) from 1918 to 1983. It elected one Member of Parliament (MP) by the first past the post voting system.
There was also an earlier Lanark Burghs constituency, from 1708 to 1832.
Boundaries
From 1918 the constituency consisted of "The Upper Ward County District, inclusive of all burghs situated therein, together with the part of the Middle Ward County District which is contained within the parishes of Avondale, East Kilbride, Glassford, and Stonehouse."
The Representation of the People Act 1948 provided that the constituency was to consist of "(i) The burghs of Biggar and Lanark; and (ii) the first, second and third districts and, so far as not included in the Hamilton constituency, the fourth and fifth districts."
Members of Parliament
| Election | Member[2] | Party | |
|---|---|---|---|
| 1918 | Walter Elliot | Unionist | |
| 1923 | Thomas Scott Dickson | Labour | |
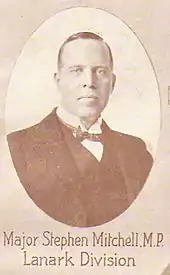
| 1924 | Stephen Mitchell | Unionist | |
| 1929 | Thomas Scott Dickson | Labour | |
| 1931 | Alec Douglas-Home, Lord Dunglass | Unionist | |
| 1945 | Tom Steele | Labour | |
| 1950 | Alec Douglas-Home, Lord Dunglass | Unionist | |
| 1951 | Patrick Maitland | Unionist | |
| 1959 | Judith Hart | Labour | |
| 1983 | Constituency abolished | ||
Election results
Elections in the 1910s
| Party | Candidate | Votes | % | ±% | |
|---|---|---|---|---|---|
| C | Unionist | Walter Elliot | 12,976 | 69.0 | |
| Labour | James C. Welsh | 5,821 | 31.0 | ||
| Majority | 7,155 | 38.0 | |||
| Turnout | 18,797 | 68.5 | |||
| Registered electors | 27,434 | ||||
| Unionist win (new seat) | |||||
| C indicates candidate endorsed by the coalition government. | |||||
Elections in the 1920s
| Party | Candidate | Votes | % | ±% | |
|---|---|---|---|---|---|
| Unionist | Walter Elliot | 12,005 | 55.0 | −14.0 | |
| Labour | Thomas Dickson | 9,812 | 45.0 | +14.0 | |
| Majority | 2,193 | 10.0 | −28.0 | ||
| Turnout | 21,817 | 75.0 | +6.5 | ||
| Registered electors | 29,074 | ||||
| Unionist hold | Swing | −14.0 | |||
| Party | Candidate | Votes | % | ±% | |
|---|---|---|---|---|---|
| Labour | Thomas Dickson | 11,384 | 50.5 | +5.5 | |
| Unionist | Walter Elliot | 11,154 | 49.5 | −5.5 | |
| Majority | 230 | 1.0 | N/A | ||
| Turnout | 22,538 | 74.9 | −0.1 | ||
| Registered electors | 30,071 | ||||
| Labour gain from Unionist | Swing | +5.5 | |||

| Party | Candidate | Votes | % | ±% | |
|---|---|---|---|---|---|
| Unionist | Stephen Mitchell | 12,714 | 48.4 | −1.1 | |
| Labour | Thomas Dickson | 11,426 | 43.5 | −7.0 | |
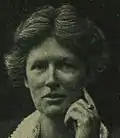
| Liberal | Elizabeth Mitchell | 2,126 | 8.1 | New | |
| Majority | 1,288 | 4.9 | N/A | ||
| Turnout | 26,266 | 84.3 | +9.4 | ||
| Registered electors | 31,164 | ||||
| Unionist gain from Labour | Swing | +3.0 | |||

| Party | Candidate | Votes | % | ±% | |
|---|---|---|---|---|---|
| Labour | Thomas Dickson | 15,054 | 48.7 | +5.2 | |
| Unionist | Stephen Mitchell | 12,652 | 41.0 | −7.4 | |
| Liberal | James Mullo Weir | 3,177 | 10.3 | +2.2 | |
| Majority | 2,402 | 7.7 | N/A | ||
| Turnout | 30,883 | 78.8 | −5.5 | ||
| Registered electors | 39,201 | ||||
| Labour gain from Unionist | Swing | +6.3 | |||
Elections in the 1930s
| Party | Candidate | Votes | % | ±% | |
|---|---|---|---|---|---|
| Unionist | Alec Douglas-Home, Lord Dunglass | 20,675 | 63.63 | ||
| Ind. Labour Party | Jack Gibson | 11,815 | 36.37 | New | |
| Majority | 8,860 | 27.26 | |||
| Turnout | 32,490 | 82.48 | |||
| Unionist gain from Labour | Swing | ||||
| Party | Candidate | Votes | % | ±% | |
|---|---|---|---|---|---|
| Unionist | Alec Douglas-Home, Lord Dunglass | 17,759 | 56.75 | ||
| Labour | Jack Gibson | 10,950 | 34.99 | ||
| Ind. Labour Party | William Carlin | 2,583 | 8.25 | ||
| Majority | 6,809 | 21.76 | |||
| Turnout | 31,292 | 75.96 | |||
| Unionist hold | Swing | ||||
Election in the 1940s
| Party | Candidate | Votes | % | ±% | |
|---|---|---|---|---|---|
| Labour | Tom Steele | 17,784 | 52.80 | ||
| Unionist | Alec Douglas-Home, Lord Dunglass | 15,900 | 47.20 | ||
| Majority | 1,884 | 5.60 | |||
| Turnout | 33,684 | 74.93 | |||
| Labour gain from Unionist | Swing | ||||
Elections in the 1950s
| Party | Candidate | Votes | % | ±% | |
|---|---|---|---|---|---|
| Unionist | Alec Douglas-Home, Lord Dunglass | 19,890 | 50.88 | ||
| Labour | Tom Steele | 19,205 | 49.12 | ||
| Majority | 685 | 1.76 | |||
| Turnout | 39,095 | 84.70 | |||
| Unionist gain from Labour | Swing | ||||
| Party | Candidate | Votes | % | ±% | |
|---|---|---|---|---|---|
| Unionist | Patrick Maitland | 21,467 | 52.18 | ||
| Labour | William L. Taylor | 19,674 | 47.82 | ||
| Majority | 1,793 | 4.36 | |||
| Turnout | 41,141 | 97.31 | |||
| Unionist hold | Swing | ||||
| Party | Candidate | Votes | % | ±% | |
|---|---|---|---|---|---|
| Unionist | Patrick Maitland | 21,828 | 51.12 | ||
| Labour | John Mackie | 20,870 | 48.88 | ||
| Majority | 958 | 2.24 | |||
| Turnout | 42,698 | 85.87 | |||
| Unionist hold | Swing | ||||
| Party | Candidate | Votes | % | ±% | |
|---|---|---|---|---|---|
| Labour | Judith Hart | 25,171 | 50.54 | ||
| Unionist | Patrick Maitland | 24,631 | 49.46 | ||
| Majority | 540 | 1.08 | |||
| Turnout | 49,802 | 87.23 | |||
| Labour gain from Unionist | Swing | ||||
Elections in the 1960s
| Party | Candidate | Votes | % | ±% | |
|---|---|---|---|---|---|
| Labour | Judith Hart | 30,242 | 54.82 | ||
| Unionist | William Beale | 24,922 | 45.18 | ||
| Majority | 5,320 | 9.64 | |||
| Turnout | 55,164 | 85.97 | |||
| Labour hold | Swing | ||||
| Party | Candidate | Votes | % | ±% | |
|---|---|---|---|---|---|
| Labour | Judith Hart | 29,735 | 51.65 | ||
| Conservative | William Beale | 21,995 | 38.21 | ||
| SNP | Harry Rankin | 5,838 | 10.14 | New | |
| Majority | 7,740 | 13.44 | |||
| Turnout | 57,568 | 83.72 | |||
| Labour hold | Swing | ||||
Elections in the 1970s
| Party | Candidate | Votes | % | ±% | |
|---|---|---|---|---|---|
| Labour | Judith Hart | 30,194 | 45.03 | ||
| Conservative | Alan C.S. MacDougall | 27,721 | 41.35 | ||
| SNP | Harry Rankin | 7,859 | 11.72 | ||
| Communist | David McDowall | 1,273 | 1.90 | New | |
| Majority | 2,473 | 3.68 | |||
| Turnout | 67,047 | 79.45 | |||
| Labour hold | Swing | ||||
| Party | Candidate | Votes | % | ±% | |
|---|---|---|---|---|---|
| Labour | Judith Hart | 16,823 | 41.69 | ||
| Conservative | Alan C. S. MacDougall | 14,723 | 36.49 | ||
| SNP | Thomas McAlpine | 8,803 | 21.82 | ||
| Majority | 2,100 | 5.20 | |||
| Turnout | 40,349 | 83.96 | |||
| Labour hold | Swing | ||||
| Party | Candidate | Votes | % | ±% | |
|---|---|---|---|---|---|
| Labour | Judith Hart | 14,948 | 37.56 | ||
| SNP | Thomas McAlpine | 14,250 | 35.81 | ||
| Conservative | A Bell | 9,222 | 23.17 | ||
| Liberal | Fred McDermid | 1,374 | 3.45 | New | |
| Majority | 698 | 1.75 | |||
| Turnout | 39,794 | 82.21 | |||
| Labour hold | Swing | ||||
| Party | Candidate | Votes | % | ±% | |
|---|---|---|---|---|---|
| Labour | Judith Hart | 18,118 | 43.2 | +5.6 | |
| Conservative | A Bell | 12,979 | 30.9 | +7.7 | |
| SNP | Thomas McAlpine | 7,902 | 18.8 | -17.0 | |
| Liberal | Fred McDermid | 2,967 | 7.1 | +3.7 | |
| Majority | 5,139 | 12.2 | +10.5 | ||
| Turnout | 41,966 | 81.8 | -0.4 | ||
| Labour hold | Swing | ||||
Notes and references
- ↑ "'Lanark', Feb 1974 – May 1983". ElectionWeb Project. Cognitive Computing Limited. Archived from the original on 3 April 2016. Retrieved 23 March 2016.
- ↑ Leigh Rayment's Historical List of MPs – Constituencies beginning with "L" (part 1)
- ↑ Whitaker's Almanack, 1920
- ↑ The Times, 17 November 1922
- ↑ The Times, 8 December 1923
- ↑ Oliver & Boyd's Edinburgh Almanack, 1927
- ↑ The Times, 1 June 1929
- ↑ Whitaker's Almanack, 1934
- ↑ Whitaker's Almanack, 1939
- ↑ The Times Guide to the House of Commons
- ↑ The Times Guide to the House of Commons
- ↑ The Times Guide to the House of Commons
- ↑ The Times Guide to the House of Commons
- ↑ The Times Guide to the House of Commons
- ↑ The Times Guide to the House of Commons
- ↑ The Times Guide to the House of Commons