Kävlinge Municipality
Kävlinge kommun | |
|---|---|
 | |
 Coat of arms | |
 | |
| Coordinates: 55°48′N 13°07′E / 55.800°N 13.117°E | |
| Country | Sweden |
| County | Scania County |
| Seat | Kävlinge |
| Area | |
| • Total | 292.45 km2 (112.92 sq mi) |
| • Land | 152.56 km2 (58.90 sq mi) |
| • Water | 139.89 km2 (54.01 sq mi) |
| Area as of 1 January 2014. | |
| Population (31 December 2021)[2] | |
| • Total | 32,341 |
| • Density | 110/km2 (290/sq mi) |
| Time zone | UTC+1 (CET) |
| • Summer (DST) | UTC+2 (CEST) |
| ISO 3166 code | SE |
| Province | Scania |
| Municipal code | 1261 |
| Website | www.kavlinge.se |
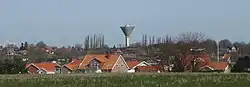
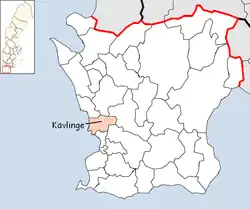
Kävlinge Municipality (Kävlinge kommun) is a municipality in Scania County in southern Sweden. Its seat is located in the town of Kävlinge.
Localities
There are nine urban areas (also called a Tätort or locality) in Kävlinge Municipality. In the table they are listed according to the size of the population as of December 31, 2005. The municipal seat is in bold characters.
| # | Locality | Population |
|---|---|---|
| 1 | Kävlinge | 10,500 |
| 2 | Löddeköpinge | 5,582 |
| 3 | Furulund | 3,888 |
| 4 | Hofterup | 3,243 |
| 5 | Dösjebro | 752 |
| 6 | Sandskogen | 533 |
| 7 | Barsebäck | 509 |
| 8 | Barsebäckshamn | 401 |
| 9 | Lilla Harrie | 321 |
Barsebäck was the location of a nuclear power plant, opened in the 1970s, but after decades of Danish protests - Copenhagen being located just across the Öresund Sound - it closed in 2005.
Demographics
This is a demographic table based on Kävlinge Municipality's electoral districts in the 2022 Swedish general election sourced from SVT's election platform, in turn taken from SCB official statistics.[3]
Residents include everyone registered as living in the district, regardless of age or citizenship status. Valid voters indicate Swedish citizens above the age of 18 who therefore can vote in general elections. Left vote and right vote indicate the result between the two major blocs in said district in the 2022 general election. Employment indicates the share of people between the ages of 20 and 64 who are working taxpayers. Foreign background is defined as residents either born abroad or with two parents born outside of Sweden. Median income is the received monthly income through either employment, capital gains or social grants for the median adult above 20, also including pensioners in Swedish kronor. The section about college graduates indicates any degree accumulated after high school.
In total there were 32,305 inhabitants, including 23,627 Swedish citizens of voting age.[3] 38.0 % voted for the left coalition and 61.2 % for the right coalition.
| Location | Residents | Valid voters | Left vote | Right vote | Employed | SV parents | 1st/2nd gen | Income | College |
|---|---|---|---|---|---|---|---|---|---|
| % | % | % | % | % | % | ||||
| Barsebäck | 2,249 | 1,656 | 32.5 | 67.2 | 87 | 91 | 9 | 36,686 | 65 |
| Furulund C | 1,690 | 1,204 | 42.6 | 55.7 | 78 | 79 | 21 | 25,095 | 42 |
| Hofterup | 2,410 | 1,773 | 28.9 | 70.7 | 85 | 90 | 10 | 33,689 | 57 |
| Karaby/Dösjebro | 1,812 | 1,353 | 36.6 | 62.9 | 88 | 90 | 10 | 31,311 | 50 |
| Korsbacka/Arvidsborg | 1,675 | 1,131 | 37.9 | 60.1 | 71 | 69 | 31 | 21,536 | 29 |
| Kävlinge N | 1,383 | 991 | 40.7 | 58.7 | 87 | 86 | 14 | 29,820 | 50 |
| Kävlinge S | 1,575 | 1,213 | 45.0 | 53.8 | 74 | 79 | 21 | 21,807 | 36 |
| Kävlinge V | 1,423 | 1,021 | 44.0 | 55.0 | 83 | 83 | 17 | 25,730 | 43 |
| Kävlinge Ö | 1,659 | 1,382 | 46.6 | 51.9 | 82 | 80 | 20 | 24,387 | 47 |
| Lackalänga | 1,539 | 1,071 | 45.8 | 53.2 | 87 | 90 | 10 | 30,541 | 53 |
| Löddeköpinge C | 1,601 | 1,181 | 39.8 | 58.9 | 84 | 87 | 13 | 26,619 | 50 |
| Nyvång | 1,797 | 1,335 | 38.7 | 60.8 | 87 | 88 | 12 | 31,412 | 56 |
| Rinnebäck | 1,991 | 1,406 | 44.8 | 54.2 | 86 | 84 | 16 | 27,831 | 43 |
| Sandskogen/Lyckorna | 1,818 | 1,394 | 32.7 | 66.9 | 89 | 88 | 12 | 31,037 | 48 |
| Stora Harrie | 1,757 | 1,301 | 36.9 | 61.9 | 88 | 88 | 12 | 31,585 | 49 |
| Stävie | 1,771 | 1,240 | 43.6 | 56.0 | 89 | 90 | 10 | 32,814 | 59 |
| Tolvåker | 2,175 | 1,513 | 35.2 | 64.3 | 86 | 88 | 12 | 29,604 | 46 |
| Ålstorp | 1,980 | 1,462 | 25.3 | 74.7 | 88 | 89 | 11 | 33,097 | 52 |
| Source: SVT[3] | |||||||||
Elections
Below are the results since the 1973 municipal reform listed. Between 1988 and 1998 the Sweden Democrats' results were not published by the SCB due to the party's small size nationwide. "Turnout" denotes the percentage of the electorate casting a ballot, but "Votes" only applies to valid ballots cast.
Riksdag
| Year | Turnout | Votes | V | S | MP | C | L | KD | M | SD | ND |
|---|---|---|---|---|---|---|---|---|---|---|---|
| 1973[4] | 94.2 | 10,389 | 1.5 | 51.8 | 0.0 | 29.9 | 6.5 | 0.3 | 9.9 | 0.0 | 0.0 |
| 1976[5] | 95.0 | 12,470 | 1.6 | 48.4 | 0.0 | 23.9 | 10.5 | 0.2 | 15.3 | 0.0 | 0.0 |
| 1979[6] | 94.1 | 12,891 | 1.9 | 48.6 | 0.0 | 16.3 | 11.1 | 0.2 | 21.6 | 0.0 | 0.0 |
| 1982[7] | 94.2 | 13,187 | 2.0 | 49.6 | 1.6 | 14.6 | 5.5 | 0.4 | 26.2 | 0.0 | 0.0 |
| 1985[8] | 92.8 | 13,497 | 2.0 | 48.0 | 1.2 | 10.5 | 13.0 | 0.0 | 25.3 | 0.0 | 0.0 |
| 1988[9] | 88.9 | 13,441 | 2.9 | 48.3 | 5.2 | 10.2 | 10.9 | 0.7 | 20.8 | 0.0 | 0.0 |
| 1991[10] | 89.6 | 14,637 | 2.0 | 40.2 | 2.4 | 6.8 | 8.1 | 4.2 | 26.4 | 0.0 | 7.6 |
| 1994[11] | 89.9 | 15,284 | 2.3 | 50.6 | 3.2 | 5.5 | 5.8 | 2.0 | 26.7 | 0.0 | 1.5 |
| 1998[12] | 83.9 | 14,564 | 6.6 | 42.1 | 2.6 | 4.0 | 3.9 | 8.3 | 27.7 | 0.0 | 0.0 |
| 2002[13] | 83.2 | 15,224 | 4.1 | 43.0 | 2.6 | 4.2 | 13.8 | 6.3 | 18.1 | 6.0 | 0.0 |
| 2006[14] | 86.0 | 16,912 | 2.2 | 35.3 | 2.6 | 5.6 | 8.6 | 4.2 | 31.8 | 7.0 | 0.0 |
| 2010[15] | 87.7 | 18,422 | 2.1 | 25.4 | 4.7 | 5.3 | 8.6 | 3.6 | 40.0 | 9.1 | 0.0 |
| 2014[16] | 89.7 | 19,329 | 2.1 | 27.1 | 5.8 | 5.6 | 6.4 | 2.8 | 29.4 | 18.9 | 0.0 |
Blocs
This lists the relative strength of the socialist and centre-right blocs since 1973, but parties not elected to the Riksdag are inserted as "other", including the Sweden Democrats results from 1988 to 2006, but also the Christian Democrats pre-1991 and the Greens in 1982, 1985 and 1991. The sources are identical to the table above. The coalition or government mandate marked in bold formed the government after the election. New Democracy got elected in 1991 but are still listed as "other" due to the short lifespan of the party. "Elected" is the total number of percentage points from the municipality that went to parties who were elected to the Riksdag.
| Year | Turnout | Votes | Left | Right | SD | Other | Elected |
|---|---|---|---|---|---|---|---|
| 1973 | 94.2 | 10,389 | 53.3 | 46.3 | 0.0 | 0.4 | 99.6 |
| 1976 | 95.0 | 12,470 | 50.0 | 49.7 | 0.0 | 0.3 | 99.7 |
| 1979 | 94.1 | 12,891 | 50.5 | 49.0 | 0.0 | 0.5 | 99.5 |
| 1982 | 94.2 | 13,187 | 51.6 | 46.3 | 0.0 | 2.1 | 97.9 |
| 1985 | 92.8 | 13,497 | 50.0 | 48.8 | 0.0 | 1.2 | 98.8 |
| 1988 | 88.9 | 13,441 | 56.4 | 41.9 | 0.0 | 1.7 | 98.3 |
| 1991 | 89.6 | 14,637 | 42.2 | 45.5 | 0.0 | 12.3 | 95.3 |
| 1994 | 89.9 | 15,284 | 56.1 | 40.0 | 0.0 | 3.9 | 96.1 |
| 1998 | 83.9 | 14,564 | 51.3 | 43.9 | 0.0 | 4.8 | 95.2 |
| 2002 | 83.2 | 15,224 | 49.9 | 42.4 | 0.0 | 7.7 | 92.3 |
| 2006 | 86.0 | 16,912 | 40.1 | 50.2 | 0.0 | 9.7 | 90.3 |
| 2010 | 87.7 | 18,422 | 32.2 | 57.5 | 9.1 | 1.2 | 98.8 |
| 2014 | 89.7 | 19,329 | 35.0 | 44.2 | 18.9 | 1.9 | 98.1 |
Twinnings
 Alatskivi Parish, Estonia[17]
References
- ↑ "Statistiska centralbyrån, Kommunarealer den 1 januari 2014" (in Swedish). Statistics Sweden. 2014-01-01. Archived from the original (Microsoft Excel) on 2016-09-27. Retrieved 2014-04-18.
- ↑ "Folkmängd i riket, län och kommuner 31 december 2021" (in Swedish). Statistics Sweden. February 22, 2022. Retrieved February 22, 2022.
- 1 2 3 "Valresultat 2022 för Kävlinge i riksdagsvalet" (in Swedish). SVT. 11 September 2022. Retrieved 2 January 2024.
- ↑ "Riksdagsvalet 1973 (page 164)" (PDF) (in Swedish). SCB. Retrieved 11 September 2017.
- ↑ "Riksdagsvalet 1976 (page 159)" (PDF) (in Swedish). SCB. Retrieved 11 September 2017.
- ↑ "Riksdagsvalet 1979 (page 183)" (PDF) (in Swedish). SCB. Retrieved 11 September 2017.
- ↑ "Riksdagsvalet 1982 (page 184)" (PDF) (in Swedish). SCB. Retrieved 11 September 2017.
- ↑ "Riksdagsvalet 1985 (page 185" (PDF) (in Swedish). SCB. Retrieved 11 September 2017.
- ↑ "Riksdagsvalet 1988 (page 166)" (PDF) (in Swedish). SCB. Retrieved 11 September 2017.
- ↑ "Riksdagsvalet 1991 (page 26)" (PDF) (in Swedish). SCB. Retrieved 11 September 2017.
- ↑ "Riksdagsvalet 1994 (page 40)" (PDF) (in Swedish). SCB. Retrieved 11 September 2017.
- ↑ "Riksdagsvalet 1998 (page 36)" (PDF) (in Swedish). SCB. Retrieved 11 September 2017.
- ↑ "Valresultat Riksdag Kävlinge kommun 2002" (in Swedish). Valmyndigheten. Retrieved 11 September 2017.
- ↑ "Valresultat Riksdag Kävlinge kommun 2006" (in Swedish). Valmyndigheten. Retrieved 11 September 2017.
- ↑ "Valresultat Riksdag Kävlinge kommun 2010" (in Swedish). Valmyndigheten. Retrieved 11 September 2017.
- ↑ "Valresultat Riksdag Kävlinge kommun 2014" (in Swedish). Valmyndigheten. Retrieved 11 September 2017.
- ↑ "Välissuhted" (in Estonian). Alatskivi vald. Retrieved 2 May 2012.
External links
- Kävlinge - Official site
Places adjacent to Kävlinge Municipality | ||||||||||||||||
|---|---|---|---|---|---|---|---|---|---|---|---|---|---|---|---|---|
| ||||||||||||||||
Municipalities and seats of Skåne County | ||
|---|---|---|
| Municipalities | ||
| Municipal seats | ||