| Demographics of Nottingham | |
|---|---|
 Population pyramid of Nottingham | |
| Population | 305,680 (2011) |
Nottingham, England is an ethnically and culturally diverse city. It is the sixteenth most populous city in the United Kingdom.
Population
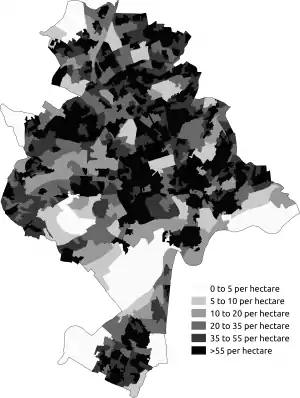
Nottingham's total population, according to the 2011 UK census, was 305,680. The population density was 4,073 people per square km.
Ethnicity

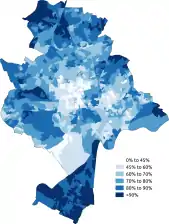
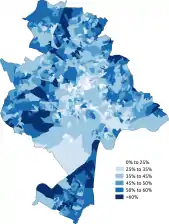
The following table shows the ethnic group of respondents in the 1991, 2001 and 2011 censuses in Nottingham. Nottingham is a majority White city with a majority of 71.5%, the largest ethnicity of which is the White British at 65.4% however this majority has been in decline since post-war migration began to the UK. Asian British residents have risen from 5.1% in 1991 to 13.1% in 2011. Black British residents have also risen with the majority of growth coming from Black Africans, going from 4.6% in 1991 to 7.3% in 2011. Mixed and Other ethnicities have also risen as a percentage of the population.
| Ethnic Group | 1971 estimations[1] | 1981 estimations[2] | 1991[3] | 2001[4] | 2011[5] | 2021[6] | ||||||
|---|---|---|---|---|---|---|---|---|---|---|---|---|
| Number | % | Number | % | Number | % | Number | % | Number | % | Number | % | |
| White: Total | 280,830 | 94.9% | 242,745 | 92% | 235,184 | 89.24% | 226,710 | 84.91% | 218,698 | 71.54% | 213,430 | 65.8% |
| White: British | – | – | – | – | – | – | 216,401 | 81.05% | 199,990 | 65.42% | 185,580 | 57.3% |
| White: Irish | – | – | – | – | 4,004 | 1.51% | 3,629 | 1.36% | 2,819 | 0.92% | 2,360 | 0.7% |
| White: Gypsy or Irish Traveller[note 1] | – | – | – | – | – | – | – | – | 326 | 0.11% | 269 | 0.1% |
| White: Roma | – | – | – | – | – | – | – | – | – | – | 1,130 | 0.3% |
| White: Other | – | – | – | – | – | – | 6,680 | 2.50% | 15,563 | 5.09% | 24,091 | 7.4% |
| Asian or Asian British: Total | – | – | – | – | 13,538 | 5.13% | 19,070 | 7.14% | 40,039 | 13.10% | 48,217 | 14.9% |
| Asian or Asian British: Indian | – | – | – | – | 4,757 | 1.8% | 6,096 | 2.28% | 9,901 | 3.24% | 11,515 | 3.6% |
| Asian or Asian British: Pakistani | – | – | – | – | 6,867 | 2.6% | 9,725 | 3.64% | 16,771 | 5.49% | 21,684 | 6.7% |
| Asian or Asian British: Bangladeshi | – | – | – | – | 301 | 0.11% | 533 | 0.20% | 1,049 | 0.34% | 2,223 | 0.7% |
| Asian or Asian British: Chinese[note 2] | – | – | – | – | 914 | 0.26% | 1,715 | 0.64% | 5,988 | 1.96% | 4,263 | 1.3% |
| Asian or Asian British: Other Asian | – | – | – | – | 699 | 0.26% | 1,001 | 0.37% | 6,330 | 2.07% | 8,532 | 2.6% |
| Black or Black British: Total | – | – | – | – | 12,176 | 4.62% | 11,582 | 4.34% | 22,185 | 7.26% | 32,215 | 10% |
| Black or Black British: African | – | – | – | – | 618 | 0.23% | 1,281 | 0.48% | 9,877 | 3.23% | 18,740 | 5.8% |
| Black or Black British: Caribbean | – | – | – | – | 8,516 | 3.23% | 9,189 | 3.44% | 9,382 | 3.07% | 9,339 | 2.9% |
| Black or Black British: Other Black | – | – | – | – | 3,042 | 1.15% | 1,112 | 0.42% | 2,926 | 0.96% | 4,136 | 1.3% |
| Mixed: Total | – | – | – | – | – | – | 8,370 | 3.13% | 20,265 | 6.63% | 19,063 | 5.9% |
| Mixed: White and Black Caribbean | – | – | – | – | – | – | 5,297 | 1.98% | 12,166 | 3.98% | 10,129 | 3.1% |
| Mixed: White and Black African | – | – | – | – | – | – | 540 | 0.20% | 2,004 | 0.66% | 2,129 | 0.7% |
| Mixed: White and Asian | – | – | – | – | – | – | 1,254 | 0.47% | 3,304 | 1.08% | 3,363 | 1.0% |
| Mixed: Other Mixed | – | – | – | – | – | – | 1,279 | 0.48% | 2,791 | 0.91% | 3,442 | 1.1% |
| Other: Total | – | – | – | – | 2,624 | 0.99% | 1,256 | 0.47% | 4,493 | 1.47% | 10,710 | 3.3% |
| Other: Arab[note 3] | – | – | – | – | – | – | – | – | 2,372 | 0.78% | 3,673 | 1.1% |
| Other: Any other ethnic group | – | – | – | – | 2,624 | 0.99% | 1,256 | 0.47% | 2,121 | 0.69% | 7,037 | 2.2% |
| Non-White: Total | 15,017 | 5.1% | 21,251 | 8% | 28,338 | 10.8% | 40,278 | 15.1% | 86,982 | 28.5 | 110,205 | 34.2% |
| Total | 295,847 | 100% | 263,996 | 100% | 263,522 | 100% | 266,988 | 100% | 305,680 | 100% | 323,635 | 100% |
Notes for table above
 White
White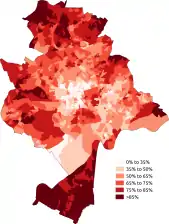 White-British
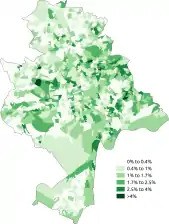 White-Irish
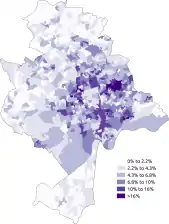 White-Other
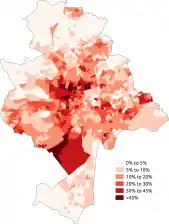 Asian
Asian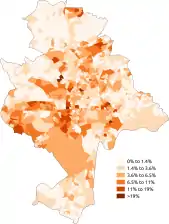 Asian-Indian
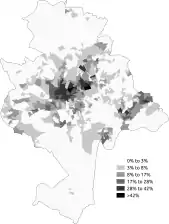 Asian-Pakistani
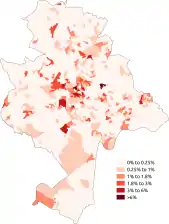 Asian-Bangladeshi
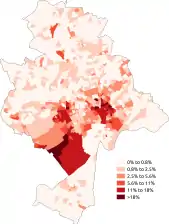 Asian-Chinese
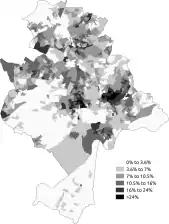 Black
Black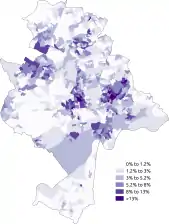 Black-African
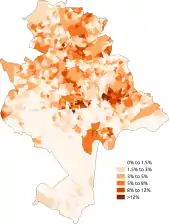 Black-Caribbean
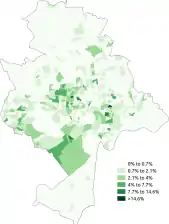 Other-Arab
Ethnicity of school pupils
| Ethnic group | School year[7][8] | |
|---|---|---|
| 2021/2022 | ||
| Number | % | |
| White: Total | 23,758 | 49.1% |
| White: British | 19,730 | 40.7% |
| White: Irish | 89 | |
| White: Traveller of Irish heritage | 40 | |
| White: Gypsy/Roma | 348 | |
| White: Other | 3,551 | |
| Asian / Asian British: Total | 9,175 | 19% |
| Asian / Asian British: Indian | 1,408 | |
| Asian / Asian British: Pakistani | 5,509 | |
| Asian / Asian British: Bangladeshi | 364 | |
| Asian / Asian British: Chinese | 334 | |
| Asian / Asian British: Other Asians | 1,560 | |
| Black / Black British: Total | 5,974 | 12.3% |
| Black: Caribbean | 1,078 | |
| Black: African | 3,982 | |
| Black: Other Blacks | 914 | |
| Mixed / British Mixed | 6,678 | 13.8% |
| Other: Total | 1,812 | 3.7% |
| Unclassified | 1,034 | 2.1% |
| Total: | 48,431 | 100% |
Languages
The most common main languages spoken in Nottingham according to the 2011 census are shown below.[9]
| Rank | Language | Usual residents aged 3+ | Proportion |
|---|---|---|---|
| 1 | English | 256,411 | 87.40% |
| 2 | Polish | 6,548 | 2.23% |
| 3 | Urdu | 4,089 | 1.39% |
| 4 | Punjabi | 2,453 | 0.84% |
| 5 | Arabic | 2,372 | 0.78% |
| 6 | Persian | 915 | 0.31% |
| 7 | Kurdish | 899 | 0.31% |
| 8 | French | 858 | 0.29% |
| 9 | Portuguese | 820 | 0.28% |
| 10 | Pakistani Pahari (with Mirpuri and Potwari) | 694 | 0.24% |
| 11 | Greek | 687 | 0.23% |
| 12 | Cantonese Chinese | 609 | 0.21% |
| 13 | Spanish | 557 | 0.19% |
| 14 | Italian | 556 | 0.19% |
| 15 | Turkish | 523 | 0.18% |
| 16 | Malay | 509 | 0.17% |
| 17 | Bengali (with Sylheti and Chatgaya) | 485 | 0.17% |
| 18 | Gujarati | 464 | 0.16% |
| 19 | Lithuanian | 461 | 0.16% |
| 20 | Hindi | 460 | 0.16% |
| Other | 12,092 | 4.12% |
Religion

The following table shows the religion of respondents in the 2001 and 2011 censuses in Nottingham.
| Religion | 2001[10] | 2011[11] | 2021[12] | |||
|---|---|---|---|---|---|---|
| Number | % | Number | % | Number | % | |
| Christian | 153,962 | 57.67 | 135,216 | 44.23 | 112,200 | 34.7 |
| Buddhist | 1,122 | 0.42 | 2,051 | 0.67 | 1,671 | 0.5 |
| Hindu | 2,225 | 0.83 | 4,498 | 1.47 | 5,403 | 1.7 |
| Jewish | 627 | 0.23 | 1,069 | 0.35 | 941 | 0.3 |
| Muslim | 12,353 | 4.63 | 26,919 | 8.81 | 39,540 | 12.2 |
| Sikh | 3,321 | 1.24 | 4,312 | 1.41 | 4,110 | 1.3 |
| Other religion | 893 | 0.33 | 1,483 | 0.49 | 2,263 | 0.7 |
| No religion | 66,312 | 24.84 | 106,954 | 34.99 | 133,403 | 41.2 |
| Religion not stated | 26,173 | 9.80 | 23,178 | 7.58 | 24,099 | 7.4 |
| Total | 266,988 | 100.00% | 305,680 | 100.00% | 323,635 | 100.00% |
 Christianity
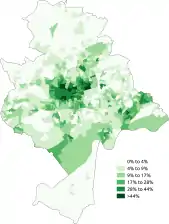 Islam
Islam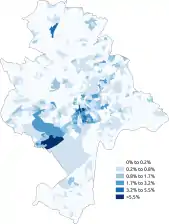 Judaism
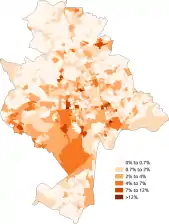 Hinduism
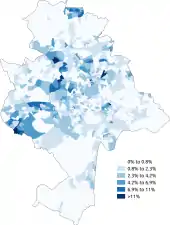 Sikhism
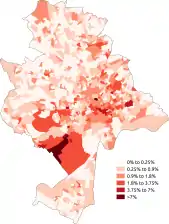 Buddhism
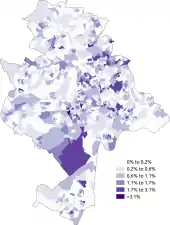 Other religion
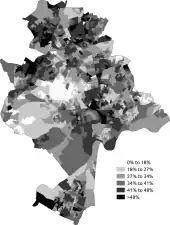 No religion
See also
- Demography of the United Kingdom
- Demography of England
- Demography of London
- Demography of Birmingham
- Demography of Greater Manchester
- List of English cities by population
- List of English districts by population
- List of English districts and their ethnic composition
- List of English districts by area
- List of English districts by population density
References
- ↑ Jones, P. N. (1978). "The Distribution and Diffusion of the Coloured Population in England and Wales, 1961-71". Transactions of the Institute of British Geographers. 3 (4): 515–532. doi:10.2307/622127. ISSN 0020-2754. JSTOR 622127. PMID 12157820.
- ↑ Equality, Commission for Racial (1985). "Ethnic minorities in Britain: statistical information on the pattern of settlement". Commission for Racial Equality: Table 2.2.
- ↑ Data is taken from United Kingdom Casweb Data services of the United Kingdom 1991 Census on Ethnic Data for England, Scotland and Wales (Table 6)
- ↑ "Office of National Statistics; 2001 Census Key Statistics". webarchive.nationalarchives.gov.uk. Retrieved 2021-09-07.
- ↑ "2011 Census: Ethnic Group, local authorities in England and Wales". webarchive.nationalarchives.gov.uk. Retrieved 2021-12-15.
- ↑ "Ethnic group - Office for National Statistics". www.ons.gov.uk. Retrieved 2022-11-29.
- ↑ "School and pupil characteristics". webarchive.nationalarchives.gov.uk. Retrieved 2022-11-08.
- ↑ "Schools, pupils and their characteristics, Academic Year 2021/22". explore-education-statistics.service.gov.uk. Retrieved 2022-09-09.
- ↑ "Download:local authorities: county / unitary". NOMIS. Retrieved 17 June 2015.
- ↑ "2001 census - theme tables". Retrieved 17 June 2015.
- ↑ "Download:local authorities: county / unitary". NOMIS. Retrieved 17 June 2015.
- ↑ "Religion - 2021 census". Office of National Statistics. 29 Nov 2022. Archived from the original on 29 Nov 2022. Retrieved 16 Dec 2022.