Baganga | |
|---|---|
| Municipality of Baganga | |
 Flag  Seal | |
| Motto: "Life Starts Here" | |
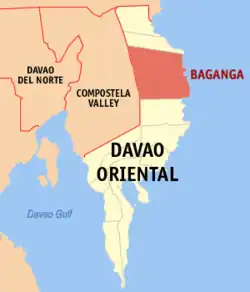
 Map of Davao Oriental with Baganga highlighted | |
OpenStreetMap | |
.svg.png.webp) Baganga Location within the Philippines | |
| Coordinates: 7°34′31″N 126°33′30″E / 7.575156°N 126.558453°E | |
| Country | Philippines |
| Region | Davao Region |
| Province | Davao Oriental |
| District | 1st district |
| Founded | October 29, 1903 |
| Barangays | 18 (see Barangays) |
| Government | |
| • Type | Sangguniang Bayan |
| • Mayor | Ronald Lara |
| • Vice Mayor | Modesto V. Layupan |
| • Representative | Nelson Dayanghirang |
| • Municipal Council | Members |
| • Electorate | 37,139 voters (2022) |
| Area | |
| • Total | 945.50 km2 (365.06 sq mi) |
| Elevation | 46 m (151 ft) |
| Highest elevation | 289 m (948 ft) |
| Lowest elevation | 0 m (0 ft) |
| Population (2020 census)[3] | |
| • Total | 58,714 |
| • Density | 62/km2 (160/sq mi) |
| • Households | 14,556 |
| Economy | |
| • Income class | 1st municipal income class |
| • Poverty incidence | 36.35 |
| • Revenue | ₱ 359.6 million (2020) |
| • Assets | ₱ 610.8 million (2020) |
| • Expenditure | ₱ 272.4 million (2020) |
| • Liabilities | ₱ 118.4 million (2020) |
| Service provider | |
| • Electricity | Davao Oriental Electric Cooperative (DORECO) |
| Time zone | UTC+8 (PST) |
| ZIP code | 8204 |
| PSGC | |
| IDD : area code | +63 (0)87 |
| Native languages | Davawenyo Cebuano Kalagan Kamayo Mandaya Mansaka |
| Website | www |
Baganga (/bəˈɡɑːŋɡə/), officially the Municipality of Baganga, is a 1st class municipality in the province of Davao Oriental, Philippines. According to the 2020 census, it has a population of 58,714 people, making it the third largest town in province.
It is the largest among the municipalities and city in the province in terms of land area, and is considered the chief town of the province's 1st legislative district.
Etymology
Baganga got its name from a thorny bush having plum like fruits that were abundant during the Spanish arrival. Others say that it was referred to a big mouth of a river that traversed the central part of the town.
History
The Mandaya tribes provided festive receptions to early Spanish explorers and received correspondingly glowing descriptions by those who accounts made it back to Spain. Garcia Descalante Alvarado, chronicling the arrival of the Villalobos Expedition on August 7, 1543, was particularly effusive in praising its beauty to King Philip II.
Under Spanish rule, Baganga was organized as part of the Encomienda de Bislig together with Cateel, Caraga and Hina-tuan of Surigao under Sargent Mayor Juan Camacho dela Peña. It was a Christian village under the Diocese of Cebu. In 1894, Baganga, together with other settlements, had its first Spanish priest, Fr. Gilbert, a Jesuit.
Baganga officially became a town on October 29, 1903, under Organic Act 21.[5] On its creation it included the barangays of Mahan-ub, Dapnan, Lambajon, San Isidro, Mikit, Campawan, San Victor, Salingcomot, Saoquigue, Baculin, Bobonao, Batawan, Binondo, Ban-ao, Central and Kinablagan. Lucod was the 18th barangay created under Provincial Resolution No. 110.
The destruction made by the Japanese during World War II in 1941 has created awareness among residents for new development. The restoration of local officials in 1949 opened it as a venue for Agri-base development. Coconut, Abaca, and fruit planting were in abundance, followed by root crops of various species suitable to the soil.
Geography
Climate
Baganga has a tropical rainforest climate (Af) with heavy to very heavy rainfall year-round.
| Climate data for Caraga | |||||||||||||
|---|---|---|---|---|---|---|---|---|---|---|---|---|---|
| Month | Jan | Feb | Mar | Apr | May | Jun | Jul | Aug | Sep | Oct | Nov | Dec | Year |
| Mean daily maximum °C (°F) | 29.9 (85.8) |
30.0 (86.0) |
30.9 (87.6) |
31.7 (89.1) |
31.8 (89.2) |
31.4 (88.5) |
31.4 (88.5) |
31.7 (89.1) |
31.8 (89.2) |
31.7 (89.1) |
31.3 (88.3) |
30.5 (86.9) |
31.2 (88.1) |
| Daily mean °C (°F) | 25.8 (78.4) |
25.9 (78.6) |
26.5 (79.7) |
27.2 (81.0) |
27.4 (81.3) |
27.0 (80.6) |
26.9 (80.4) |
27.1 (80.8) |
27.1 (80.8) |
27.1 (80.8) |
26.8 (80.2) |
26.3 (79.3) |
26.8 (80.2) |
| Mean daily minimum °C (°F) | 21.8 (71.2) |
21.9 (71.4) |
22.1 (71.8) |
22.7 (72.9) |
23.0 (73.4) |
22.7 (72.9) |
22.5 (72.5) |
22.6 (72.7) |
22.5 (72.5) |
22.6 (72.7) |
22.4 (72.3) |
22.2 (72.0) |
22.4 (72.4) |
| Average rainfall mm (inches) | 649 (25.6) |
480 (18.9) |
415 (16.3) |
277 (10.9) |
203 (8.0) |
120 (4.7) |
113 (4.4) |
94 (3.7) |
93 (3.7) |
169 (6.7) |
254 (10.0) |
534 (21.0) |
3,401 (133.9) |
| Source: Climate-Data.org[6] | |||||||||||||
Barangays
Baganga is politically subdivided into 18 barangays. Each barangay consists of puroks while some have sitios.
- Baculin
- Ban-ao
- Batawan
- Batiano
- Binondo
- Bobonao
- Campawan
- Central
- Dapnan
- Kinablangan
- Lambajon
- Lucod
- Mahan-ub
- Mikit
- Salingcomot
- San Isidro
- San Victor
- Saoquigue
Salingcomot
- Carolina lake
- Pilot view beach resort
- Mangrove area under rahabilation of DENR
- Philippines army (67IB Aguila)
Campawan
This barangay is home to a lot of waterfalls, and one of the major attraction of "Campawan" is the so-called "Curtain Falls".
Dapnan
Dapnan is home to many white-sand beaches in Baganga like the famous Agawon Beach. The major industry of this small barangay is the coconut industry.
Tourist spots:
- Sunrise Boulevard
Kinablangan
On October 18 Kinablanganion celebrate the Araw Ng Kinablangan (Day of Kinablangan) or the Niyogan Festival. The economic strength is agriculture and fishing.
Schools:
- Kinablangan Elementary School
- Dr. Beato C. Macayra National High School
- POO Elementary School
Tourist spots:
- Floating Cottage
- Balite Hot Spring (locally called "Mainit")
- Punta (Poo Island)
- Sandbar, Poo Kinablangan
Mahan-ub
Mahan-ub is derived its name from the river "mahan-ub". This Barangay is located in a remote area, and subdivided into 12 puroks (Olin, Catabuanan II, Banahao, Pagsingitan, Abuyuan, Coog, Mercedez, R. C., Kaputian, Kasunugan, Kati-han II, Bisaya). The present Barangay Chairman is Roy Aguilon Nazareno. Their economic strength is agruculture, producing rice, coconut, abaca, and logs. They celebrate the annual fiesta every June 13 in honor of the patron San Antonio de Padua. They celebrate the Araw ng Mahan-ub every June 11 the Carabao Festival.
Schools:
- R. C. Macayra Elementary School
- Coog Elementary School
Tourist spots:
- Katiquipan Falls
San Victor
San Victor is a small barangay located on San Victor Island. The major sources of income are subsistence farming and fishing. The barangay captain is Ike Fontillas.
School:
- San Victor Elementary School
Saoquigue
Saoquigue is a remote barangay, subdivided into 8 purok's or wards. The present Barangay Chairman is Mr. Balug. The predominant source of income is agriculture (coconut) and fishing, with some shops and marketing businesses buying copra and charcoal from coconut shells.
School:
- Saoquigue Elementary School
Demographics
| Year | Pop. | ±% p.a. |
|---|---|---|
| 1903 | 2,985 | — |
| 1918 | 6,175 | +4.97% |
| 1939 | 8,737 | +1.67% |
| 1948 | 10,002 | +1.51% |
| 1960 | 17,993 | +5.01% |
| 1970 | 27,678 | +4.40% |
| 1975 | 32,670 | +3.38% |
| 1980 | 40,039 | +4.15% |
| 1990 | 37,719 | −0.60% |
| 1995 | 39,750 | +0.99% |
| 2000 | 43,122 | +1.76% |
| 2007 | 48,355 | +1.59% |
| 2010 | 53,426 | +3.70% |
| 2015 | 56,241 | +0.98% |
| 2020 | 58,714 | +0.85% |
| Source: Philippine Statistics Authority[7][8][9][10] | ||
Language
Baganga, as part of Davao Oriental, uses the Southern Kamayo dialect. The Southern Kamayo is quite different from the Kamayo language of Bislig, Surigao Del Sur. Southern Kamayo is also spoken in Southern Lingig, Surigao del Sur, in Cateel, Caraga and some parts of Davao Oriental. It is also related to Surigaonon and Butuanon.
Dialect variations are caused by mixed dialect communications between the Mandaya, Cebuano and other immigrants now living in the area. A suffix is added in most adjectives. Example: The word gamay in Cebuano (English: "small") is gamayay in Baganga. But you can't use the "ay" suffix always with adjectives. For instance, the word dako (English; "big") is spoken as "bagas-AY" or "bagasay" instead of saying "dako-ay". dutayay (English: "very small")
Economy
See also
References
- ↑ Municipality of Baganga | (DILG)
- ↑ "2015 Census of Population, Report No. 3 – Population, Land Area, and Population Density" (PDF). Philippine Statistics Authority. Quezon City, Philippines. August 2016. ISSN 0117-1453. Archived (PDF) from the original on May 25, 2021. Retrieved July 16, 2021.
- ↑ Census of Population (2020). "Region XI (Davao Region)". Total Population by Province, City, Municipality and Barangay. Philippine Statistics Authority. Retrieved July 8, 2021.
- ↑ "PSA Releases the 2018 Municipal and City Level Poverty Estimates". Philippine Statistics Authority. December 15, 2021. Retrieved January 22, 2022.
- ↑ "Executive Summary - Baganga, Davao Oriental" (PDF). Archived from the original (PDF) on August 26, 2021. Retrieved August 26, 2021.
- ↑ "Climate: Baganga". Climate-Data.org. Retrieved October 25, 2020.
- ↑ Census of Population (2015). "Region XI (Davao Region)". Total Population by Province, City, Municipality and Barangay. Philippine Statistics Authority. Retrieved June 20, 2016.
- ↑ Census of Population and Housing (2010). "Region XI (Davao Region)" (PDF). Total Population by Province, City, Municipality and Barangay. National Statistics Office. Retrieved June 29, 2016.
- ↑ Censuses of Population (1903–2007). "Region XI (Davao Region)". Table 1. Population Enumerated in Various Censuses by Province/Highly Urbanized City: 1903 to 2007. National Statistics Office.
{{cite encyclopedia}}: CS1 maint: numeric names: authors list (link) - ↑ "Province of Davao Oriental". Municipality Population Data. Local Water Utilities Administration Research Division. Retrieved December 17, 2016.
- ↑ "Poverty incidence (PI):". Philippine Statistics Authority. Retrieved December 28, 2020.
- ↑ "Estimation of Local Poverty in the Philippines" (PDF). Philippine Statistics Authority. November 29, 2005.
- ↑ "2003 City and Municipal Level Poverty Estimates" (PDF). Philippine Statistics Authority. March 23, 2009.
- ↑ "City and Municipal Level Poverty Estimates; 2006 and 2009" (PDF). Philippine Statistics Authority. August 3, 2012.
- ↑ "2012 Municipal and City Level Poverty Estimates" (PDF). Philippine Statistics Authority. May 31, 2016.
- ↑ "Municipal and City Level Small Area Poverty Estimates; 2009, 2012 and 2015". Philippine Statistics Authority. July 10, 2019.
- ↑ "PSA Releases the 2018 Municipal and City Level Poverty Estimates". Philippine Statistics Authority. December 15, 2021. Retrieved January 22, 2022.