| |||||||||||||||||||||||||||||||||||||
All 124 seats in the South Carolina House of Representatives 63 seats needed for a majority | |||||||||||||||||||||||||||||||||||||
|---|---|---|---|---|---|---|---|---|---|---|---|---|---|---|---|---|---|---|---|---|---|---|---|---|---|---|---|---|---|---|---|---|---|---|---|---|---|
| Turnout | 55.03% | ||||||||||||||||||||||||||||||||||||
| |||||||||||||||||||||||||||||||||||||
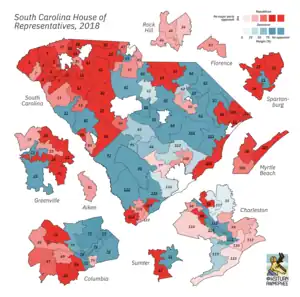 Results by district | |||||||||||||||||||||||||||||||||||||
| |||||||||||||||||||||||||||||||||||||
| Elections in South Carolina |
|---|
 |
The 2018 South Carolina House of Representatives elections took place as part of the biennial United States elections. South Carolina voters elected state representatives in all 124 of the state house's districts. State representatives serve two-year terms in the South Carolina State House. A statewide map of South Carolina's state House districts can be obtained from the South Carolina House's website here, and individual district maps can be obtained from the U.S. Census here.
A primary election on June 12, 2018, and a primary runoff on June 26, 2018, in races in which no candidate received over 50% of his/her party's primary vote, determined which candidates appeared on the November 6 general election ballot. Primary election results can be obtained from the South Carolina Secretary of State's website.[1]
Following the 2016 state house elections, Republicans maintained effective control of the House with 80 members. Democrats held 44 seats following the 2016 elections.
In the 2018 election, although multiple seats flipped between parties, there was no net change. Therefore, Republicans maintained an 80-to-44-seat majority over Democrats.
Results
 | ||||||
| Party | Votes | Seats | ||||
|---|---|---|---|---|---|---|
| No. | % | No. | +/− | % | ||
| South Carolina Republican Party | 869,238 | 58.48 | 80 | 0 | 64.52 | |
| South Carolina Democratic Party | 572,739 | 38.53 | 44 | 0 | 35.48 | |
| Write-in | 17,271 | 1.16 | 0 | 0 | 0.00 | |
| Libertarian Party of South Carolina | 13,064 | 0.88 | 0 | 0 | 0.00 | |
| Working Families Party | 4,612 | 0.31 | 0 | 0 | 0.00 | |
| American Party of South Carolina | 4,294 | 0.29 | 0 | 0 | 0.00 | |
| United Citizens Party | 3,611 | 0.24 | 0 | 0 | 0.00 | |
| Independent | 1,648 | 0.11 | 0 | 0 | 0.00 | |
| Total | 1,486,477 | 100.00 | 124 | ±0 | 100.00 | |
| Registered voters | 3,137,659 | 100.00 | ||||
| Turnout | 1,486,477 | 47.38 | ||||
| Source: South Carolina Election Commission[1] | ||||||
Summary of results by State House District
Election results:[2]
Detailed Results by State House District
District 1
| Party | Candidate | Votes | % | |
|---|---|---|---|---|
| Republican | Bill Whitmire (incumbent) | 11,287 | 98.63 | |
| Write-in | 157 | 1.37 | ||
| Total votes | 11,444 | 100.0 | ||
| Republican hold | ||||
District 2
| Party | Candidate | Votes | % | |
|---|---|---|---|---|
| Republican | Bill Sandifer (incumbent) | 9,276 | 64.11 | |
| Democratic | Jody G. Gaulin | 5,178 | 35.79 | |
| Write-in | 15 | 0.10 | ||
| Total votes | 14,469 | 100.0 | ||
| Republican hold | ||||
District 3
| Party | Candidate | Votes | % | |
|---|---|---|---|---|
| Republican | Gary Clary (incumbent) | 7,576 | 97.18 | |
| Write-in | 220 | 2.82 | ||
| Total votes | 7,796 | 100.0 | ||
| Republican hold | ||||
District 4
| Party | Candidate | Votes | % | |
|---|---|---|---|---|
| Republican | Davey Hiott (incumbent) | 11,883 | 98.74 | |
| Write-in | 152 | 1.26 | ||
| Total votes | 12,035 | 100.0 | ||
| Republican hold | ||||
District 5
| Party | Candidate | Votes | % | |
|---|---|---|---|---|
| Republican | Neal Collins (incumbent) | 11,617 | 97.21 | |
| Write-in | 334 | 2.79 | ||
| Total votes | 11,951 | 100.0 | ||
| Republican hold | ||||
District 6
| Party | Candidate | Votes | % | |
|---|---|---|---|---|
| Republican | Brian White (incumbent) | 10,243 | 82.52 | |
| American | Ryan Cowsert | 2,095 | 16.88 | |
| Write-in | 75 | 0.60 | ||
| Total votes | 12,413 | 100.0 | ||
| Republican hold | ||||
District 7
| Party | Candidate | Votes | % | |
|---|---|---|---|---|
| Republican | Jay West (incumbent) | 8,201 | 98.56 | |
| Write-in | 120 | 1.44 | ||
| Total votes | 8,321 | 100.0 | ||
| Republican hold | ||||
District 8
| Party | Candidate | Votes | % | |
|---|---|---|---|---|
| Republican | Jonathon Hill (incumbent) | 10,186 | 98.15 | |
| Write-in | 192 | 1.85 | ||
| Total votes | 10,378 | 100.0 | ||
| Republican hold | ||||
District 9
| Party | Candidate | Votes | % | |
|---|---|---|---|---|
| Republican | Anne Thayer (incumbent) | 9,165 | 97.89 | |
| Write-in | 198 | 2.11 | ||
| Total votes | 9,363 | 100.0 | ||
| Republican hold | ||||
District 10
| Party | Candidate | Votes | % | |
|---|---|---|---|---|
| Republican | West Cox | 10,471 | 76.63 | |
| Democratic | Lucy Hoffman | 3,190 | 23.35 | |
| Write-in | 3 | 0.02 | ||
| Total votes | 13,664 | 100.0 | ||
| Republican hold | ||||
District 11
| Party | Candidate | Votes | % | |
|---|---|---|---|---|
| Republican | Craig A. Gagnon (incumbent) | 7,292 | 65.50 | |
| Democratic | Devon D. Smith | 3,832 | 34.42 | |
| Write-in | 9 | 0.08 | ||
| Total votes | 11,133 | 100.0 | ||
| Republican hold | ||||
District 12
| Party | Candidate | Votes | % | |
|---|---|---|---|---|
| Democratic | Anne Parks (incumbent) | 7,256 | 96.70 | |
| Write-in | 248 | 3.30 | ||
| Total votes | 7,504 | 100.0 | ||
| Democratic hold | ||||
District 13
| Party | Candidate | Votes | % | |
|---|---|---|---|---|
| Republican | John McCravy (incumbent) | 10,353 | 71.55 | |
| Democratic | Michael Gaskin | 4,109 | 28.40 | |
| Write-in | 7 | 0.05 | ||
| Total votes | 14,469 | 100.0 | ||
| Republican hold | ||||
District 14
| Party | Candidate | Votes | % | |
|---|---|---|---|---|
| Republican | Mike Pitts (incumbent) | 10,356 | 97.86 | |
| Write-in | 226 | 2.14 | ||
| Total votes | 10,582 | 100.0 | ||
| Republican hold | ||||
District 15
| Party | Candidate | Votes | % | |
|---|---|---|---|---|
| Democratic | J.A. Moore | 4,569 | 49.67 | |
| Working Families | J.A. Moore | 249 | 2.71 | |
| TOTAL | J.A. Moore | 4,818 | 52.38 | |
| Republican | Samuel Rivers, Jr. (incumbent) | 4,372 | 47.53 | |
| Write-in | 9 | 0.10 | ||
| Total votes | 9,199 | 100.0 | ||
| Democratic gain from Republican | ||||
District 16
| Party | Candidate | Votes | % | |
|---|---|---|---|---|
| Republican | Mark Willis (incumbent) | 9,259 | 97.11 | |
| Write-in | 276 | 2.89 | ||
| Total votes | 9,535 | 100.0 | ||
| Republican hold | ||||
District 17
| Party | Candidate | Votes | % | |
|---|---|---|---|---|
| Republican | Mike Burns (incumbent) | 11,598 | 76.03 | |
| Democratic | Judi Buckley | 3,641 | 23.87 | |
| Write-in | 15 | 0.10 | ||
| Total votes | 15,254 | 100.0 | ||
| Republican hold | ||||
District 18
| Party | Candidate | Votes | % | |
|---|---|---|---|---|
| Republican | Tommy Stringer (incumbent) | 12,110 | 97.96 | |
| Write-in | 252 | 2.04 | ||
| Total votes | 12,362 | 100.0 | ||
| Republican hold | ||||
District 19
| Party | Candidate | Votes | % | |
|---|---|---|---|---|
| Republican | Dwight Loftis (incumbent) | 6,744 | 61.16 | |
| TOTAL | Carrie Counton | 4,272 | 38.74 | |
| Democratic | Carrie Counton | 4,038 | 36.62 | |
| Working Families | Carrie Counton | 234 | 2.12 | |
| Write-in | 10 | 0.09 | ||
| Total votes | 11,026 | 100.0 | ||
| Republican hold | ||||
District 20
| Party | Candidate | Votes | % | |
|---|---|---|---|---|
| Republican | Adam Morgan | 12,234 | 97.61 | |
| Write-in | 299 | 2.39 | ||
| Total votes | 12,533 | 100.0 | ||
| Republican hold | ||||
District 21
| Party | Candidate | Votes | % | |
|---|---|---|---|---|
| Republican | Bobby Cox | 13,826 | 97.93 | |
| Write-in | 292 | 2.07 | ||
| Total votes | 14,118 | 100.0 | ||
| Republican hold | ||||
District 22
| Party | Candidate | Votes | % | |
|---|---|---|---|---|
| Republican | Jason Elliott (incumbent) | 9,955 | 63.35 | |
| Democratic | B.K. Brown | 5,673 | 36.10 | |
| Write-in | 86 | 0.55 | ||
| Total votes | 15,714 | 100.0 | ||
| Republican hold | ||||
District 23
| Party | Candidate | Votes | % | |
|---|---|---|---|---|
| Democratic | Chandra Dillard (incumbent) | 7,728 | 97.72 | |
| Write-in | 180 | 2.28 | ||
| Total votes | 7,908 | 100.0 | ||
| Democratic hold | ||||
District 24
| Party | Candidate | Votes | % | |
|---|---|---|---|---|
| Republican | Bruce Bannister (incumbent) | 12,992 | 97.03 | |
| Write-in | 398 | 2.97 | ||
| Total votes | 13,390 | 100.0 | ||
| Republican hold | ||||
District 25
| Party | Candidate | Votes | % | |
|---|---|---|---|---|
| Democratic | Leola Robinson-Simpson (incumbent) | 7,623 | 81.57 | |
| Independent | Tony Boyce | 1,648 | 17.64 | |
| Write-in | 74 | 0.79 | ||
| Total votes | 9,345 | 100.0 | ||
| Democratic hold | ||||
District 26
| Party | Candidate | Votes | % | |
|---|---|---|---|---|
| Republican | Raye Felder (incumbent) | 10,940 | 57.12 | |
| Democratic | John Kraljevich | 8,205 | 42.84 | |
| Write-in | 9 | 0.05 | ||
| Total votes | 19,154 | 100.0 | ||
| Republican hold | ||||
District 27
| Party | Candidate | Votes | % | |
|---|---|---|---|---|
| Republican | Garry R. Smith (incumbent) | 10,994 | 96.74 | |
| Write-in | 371 | 3.26 | ||
| Total votes | 11,365 | 100.0 | ||
| Republican hold | ||||
District 28
| Party | Candidate | Votes | % | |
|---|---|---|---|---|
| Republican | Ashley Trantham (incumbent) | 11,804 | 97.30 | |
| Write-in | 328 | 2.70 | ||
| Total votes | 12,132 | 100.0 | ||
| Republican hold | ||||
District 29
| Party | Candidate | Votes | % | |
|---|---|---|---|---|
| Republican | Dennis Moss (incumbent) | 9,711 | 98.59 | |
| Write-in | 139 | 1.41 | ||
| Total votes | 9,850 | 100.0 | ||
| Republican hold | ||||
District 30
| Party | Candidate | Votes | % | |
|---|---|---|---|---|
| Republican | Steve Moss (incumbent) | 8,550 | 98.86 | |
| Write-in | 99 | 1.14 | ||
| Total votes | 8,649 | 100.0 | ||
| Republican hold | ||||
District 31
| Party | Candidate | Votes | % | |
|---|---|---|---|---|
| Democratic | Rosalyn Henderson-Myers (incumbent) | 6,598 | 98.85 | |
| Write-in | 77 | 1.15 | ||
| Total votes | 6,675 | 100.0 | ||
| Democratic hold | ||||
District 32
| Party | Candidate | Votes | % | |
|---|---|---|---|---|
| Republican | Max Hyde | 10,239 | 98.12 | |
| Write-in | 196 | 1.88 | ||
| Total votes | 10,435 | 100.0 | ||
| Republican hold | ||||
District 33
| Party | Candidate | Votes | % | |
|---|---|---|---|---|
| Republican | Eddie Tallon (incumbent) | 10,378 | 98.48 | |
| Write-in | 160 | 1.52 | ||
| Total votes | 10,538 | 100.0 | ||
| Republican hold | ||||
District 34
| Party | Candidate | Votes | % | |
|---|---|---|---|---|
| Republican | Mike Forrester (incumbent) | 9,668 | 97.28 | |
| Write-in | 270 | 2.72 | ||
| Total votes | 9,938 | 100.0 | ||
| Republican hold | ||||
District 35
| Party | Candidate | Votes | % | |
|---|---|---|---|---|
| Republican | Bill Chumley (incumbent) | 11,437 | 65.20 | |
| Democratic | Helen Pendarvis | 6,071 | 34.61 | |
| Write-in | 33 | 0.19 | ||
| Total votes | 17,541 | 100.0 | ||
| Republican hold | ||||
District 36
| Party | Candidate | Votes | % | |
|---|---|---|---|---|
| Republican | Rita Allison (incumbent) | 8,790 | 97.59 | |
| Write-in | 217 | 2.41 | ||
| Total votes | 9,007 | 100.0 | ||
| Republican hold | ||||
District 37
| Party | Candidate | Votes | % | |
|---|---|---|---|---|
| Republican | Steven Long (incumbent) | 8,733 | 97.44 | |
| Write-in | 229 | 2.56 | ||
| Total votes | 8,962 | 100.0 | ||
| Republican hold | ||||
District 38
| Party | Candidate | Votes | % | |
|---|---|---|---|---|
| Republican | Josiah Magnuson (incumbent) | 11,106 | 98.04 | |
| Write-in | 222 | 1.96 | ||
| Total votes | 11,328 | 100.0 | ||
| Republican hold | ||||
District 39
| Party | Candidate | Votes | % | |
|---|---|---|---|---|
| Republican | Cal Forrest (incumbent) | 10,424 | 98.90 | |
| Write-in | 116 | 1.10 | ||
| Total votes | 10,540 | 100.0 | ||
| Republican hold | ||||
District 40
| Party | Candidate | Votes | % | |
|---|---|---|---|---|
| Republican | Richard Martin (incumbent) | 9,212 | 98.17 | |
| Write-in | 172 | 1.83 | ||
| Total votes | 9,384 | 100.0 | ||
| Republican hold | ||||
District 41
| Party | Candidate | Votes | % | |
|---|---|---|---|---|
| Democratic | Annie McDaniel | 9,630 | 78.15 | |
| United Citizens | Fred Kennedy | 2,593 | 21.04 | |
| Write-in | 99 | 0.80 | ||
| Total votes | 12,322 | 100.0 | ||
| Democratic hold | ||||
District 42
| Party | Candidate | Votes | % | |
|---|---|---|---|---|
| Republican | Doug Gilliam | 8,074 | 98.21 | |
| Write-in | 147 | 1.79 | ||
| Total votes | 8,221 | 100.0 | ||
| Republican gain from Democratic | ||||
District 43
| Party | Candidate | Votes | % | |
|---|---|---|---|---|
| Republican | Randy Ligon | 8,247 | 65.75 | |
| Democratic | Tom Hawk | 4,293 | 34.23 | |
| Write-in | 3 | 0.02 | ||
| Total votes | 12,543 | 100.0 | ||
| Republican hold | ||||
District 44
| Party | Candidate | Votes | % | |
|---|---|---|---|---|
| Democratic | Mandy Powers Norrell (incumbent) | 6,903 | 93.32 | |
| Write-in | 494 | 6.68 | ||
| Total votes | 7,397 | 100.0 | ||
| Democratic hold | ||||
District 45
| Party | Candidate | Votes | % | |
|---|---|---|---|---|
| Republican | Brandon Newton (incumbent) | 15,125 | 62.47 | |
| TOTAL | Corin Buskey | 9,075 | 37.48 | |
| Democratic | Corin Buskey | 8,729 | 36.05 | |
| Working Families | Corin Buskey | 346 | 1.43 | |
| Write-in | 13 | 0.05 | ||
| Total votes | 24,213 | 100.0 | ||
| Republican hold | ||||
District 46
| Party | Candidate | Votes | % | |
|---|---|---|---|---|
| Republican | Gary Simrill (incumbent) | 9,395 | 60.56 | |
| Democratic | Carl Kenny Dicks | 6,104 | 39.35 | |
| Write-in | 14 | 0.09 | ||
| Total votes | 15,513 | 100.0 | ||
| Republican hold | ||||
District 47
| Party | Candidate | Votes | % | |
|---|---|---|---|---|
| Republican | Tommy Pope (incumbent) | 10,894 | 71.57 | |
| Democratic | Marty R. Cotton | 4,315 | 28.35 | |
| Write-in | 12 | 0.08 | ||
| Total votes | 15,221 | 100.0 | ||
| Republican hold | ||||
District 48
| Party | Candidate | Votes | % | |
|---|---|---|---|---|
| Republican | Bruce M. Bryant (incumbent) | 10,504 | 60.79 | |
| Democratic | Vickie Holt | 6,764 | 39.15 | |
| Write-in | 11 | 0.06 | ||
| Total votes | 17,279 | 100.0 | ||
| Republican hold | ||||
District 49
| Party | Candidate | Votes | % | |
|---|---|---|---|---|
| Democratic | John R. King (incumbent) | 7,830 | 75.54 | |
| Working Families | John R. King (incumbent) | 597 | 5.76 | |
| TOTAL | John R. King (incumbent) | 8,427 | 81.3 | |
| American | Johnny Walker | 1,886 | 18.20 | |
| Write-in | 52 | 0.50 | ||
| Total votes | 10,365 | 100.0 | ||
| Democratic hold | ||||
District 50
| Party | Candidate | Votes | % | |
|---|---|---|---|---|
| Democratic | Will Wheeler (incumbent) | 9,139 | 98.51 | |
| Write-in | 138 | 1.49 | ||
| Total votes | 9,277 | 100.0 | ||
| Democratic hold | ||||
District 51
| Party | Candidate | Votes | % | |
|---|---|---|---|---|
| Democratic | David Weeks (incumbent) | 8,758 | 99.01 | |
| Write-in | 88 | 0.99 | ||
| Total votes | 8,846 | 100.0 | ||
| Democratic hold | ||||
District 52
| Party | Candidate | Votes | % | |
|---|---|---|---|---|
| Democratic | Laurie Slade Funderburk (incumbent) | 9,017 | 57.41 | |
| Republican | Penry Gustafson | 6,672 | 42.48 | |
| Write-in | 18 | 0.11 | ||
| Total votes | 15,707 | 100.0 | ||
| Democratic hold | ||||
District 53
| Party | Candidate | Votes | % | |
|---|---|---|---|---|
| Republican | Richie Yow (incumbent) | 6,521 | 98.37 | |
| Write-in | 108 | 1.63 | ||
| Total votes | 6,629 | 100.0 | ||
| Republican hold | ||||
District 54
| Party | Candidate | Votes | % | |
|---|---|---|---|---|
| Democratic | Patricia "Pat" Moore Henegan (incumbent) | 7,189 | 97.80 | |
| Write-in | 162 | 2.20 | ||
| Total votes | 7,351 | 100.0 | ||
| Democratic hold | ||||
District 55
| Party | Candidate | Votes | % | |
|---|---|---|---|---|
| Democratic | Jackie E. Hayes (incumbent) | 6,758 | 97.04 | |
| Write-in | 206 | 2.96 | ||
| Total votes | 6,964 | 100.0 | ||
| Democratic hold | ||||
District 56
| Party | Candidate | Votes | % | |
|---|---|---|---|---|
| Republican | Tim McGinnis (incumbent) | 10,984 | 97.59 | |
| Write-in | 271 | 2.41 | ||
| Total votes | 11,255 | 100.0 | ||
| Republican hold | ||||
District 57
| Party | Candidate | Votes | % | |
|---|---|---|---|---|
| Democratic | Lucas Atkinson (incumbent) | 8,946 | 98.98 | |
| Write-in | 92 | 1.02 | ||
| Total votes | 9,038 | 100.0 | ||
| Democratic hold | ||||
District 58
| Party | Candidate | Votes | % | |
|---|---|---|---|---|
| Republican | Jeff Johnson (incumbent) | 9,580 | 98.65 | |
| Write-in | 131 | 1.35 | ||
| Total votes | 9,711 | 100.0 | ||
| Republican hold | ||||
District 59
| Party | Candidate | Votes | % | |
|---|---|---|---|---|
| Democratic | Terry Alexander (incumbent) | 9,064 | 98.31 | |
| Write-in | 156 | 1.69 | ||
| Total votes | 9,220 | 100.0 | ||
| Democratic hold | ||||
District 60
| Party | Candidate | Votes | % | |
|---|---|---|---|---|
| Republican | Phillip Lowe (incumbent) | 7,548 | 61.11 | |
| Democratic | Devon Justin Long | 4,794 | 38.81 | |
| Write-in | 10 | 0.08 | ||
| Total votes | 12,352 | 100.0 | ||
| Republican hold | ||||
District 61
| Party | Candidate | Votes | % | |
|---|---|---|---|---|
| Democratic | Roger K. Kirby (incumbent) | 7,246 | 98.54 | |
| Write-in | 107 | 1.46 | ||
| Total votes | 7,246 | 100.0 | ||
| Democratic hold | ||||
District 62
| Party | Candidate | Votes | % | |
|---|---|---|---|---|
| Democratic | Robert Williams (incumbent) | 7,821 | 63.12 | |
| Republican | Billy Baldwin | 4,555 | 36.76 | |
| Write-in | 15 | 0.15 | ||
| Total votes | 12,391 | 100.0 | ||
| Democratic hold | ||||
District 63
| Party | Candidate | Votes | % | |
|---|---|---|---|---|
| Republican | Jay Jordan (incumbent) | 9,171 | 64.60 | |
| Democratic | Mike Brank | 5,016 | 35.33 | |
| Write-in | 9 | 0.06 | ||
| Total votes | 14,196 | 100.0 | ||
| Republican hold | ||||
District 64
| Party | Candidate | Votes | % | |
|---|---|---|---|---|
| Democratic | Robert L. Ridgeway III (incumbent) | 9,665 | 98.70 | |
| Write-in | 127 | 1.30 | ||
| Total votes | 9,792 | 100.0 | ||
| Democratic hold | ||||
District 65
| Party | Candidate | Votes | % | |
|---|---|---|---|---|
| Republican | Jay Lucas (incumbent) | 8,962 | 98.83 | |
| Write-in | 106 | 1.17 | ||
| Total votes | 9,068 | 100.0 | ||
| Republican hold | ||||
District 66
| Party | Candidate | Votes | % | |
|---|---|---|---|---|
| Democratic | Gilda Cobb-Hunter (incumbent) | 8,800 | 71.53 | |
| Republican | Tom Connor | 3,497 | 28.42 | |
| Write-in | 6 | 0.05 | ||
| Total votes | 12,303 | 100.0 | ||
| Democratic hold | ||||
District 67
| Party | Candidate | Votes | % | |
|---|---|---|---|---|
| Republican | Murrell "George" Smith (incumbent) | 8,640 | 82.17 | |
| Libertarian | Brandon Humphries | 1,811 | 17.22 | |
| Write-in | 64 | 0.61 | ||
| Total votes | 10,515 | 100.0 | ||
| Republican hold | ||||
District 68
| Party | Candidate | Votes | % | |
|---|---|---|---|---|
| Republican | Heather Ammons Crawford (incumbent) | 9,457 | 79.29 | |
| Libertarian | Cameron Ventura | 2,408 | 20.19 | |
| Write-in | 62 | 0.52 | ||
| Total votes | 11,927 | 100.0 | ||
| Republican hold | ||||
District 69
| Party | Candidate | Votes | % | |
|---|---|---|---|---|
| Republican | Chris Wooten (incumbent) | 10,587 | 64.69 | |
| TOTAL | Beth Ann Rocheleau | 5,330 | 32.56 | |
| Democratic | Beth Ann Rocheleau | 5,074 | 31.00 | |
| Working Families | Beth Ann Rocheleau | 256 | 1.56 | |
| Libertarian | David Morris | 425 | 2.60 | |
| Write-in | 24 | 0.15 | ||
| Total votes | 16,366 | 100.0 | ||
| Republican hold | ||||
District 70
| Party | Candidate | Votes | % | |
|---|---|---|---|---|
| Democratic | Wendy C. Brawley (incumbent) | 9,820 | 98.21 | |
| Write-in | 179 | 1.79 | ||
| Total votes | 9,999 | 100.0 | ||
| Democratic hold | ||||
District 71
| Party | Candidate | Votes | % | |
|---|---|---|---|---|
| Republican | Nathan Ballentine (incumbent) | 13,844 | 97.35 | |
| Write-in | 377 | 2.65 | ||
| Total votes | 14,221 | 100.0 | ||
| Republican hold | ||||
District 72
| Party | Candidate | Votes | % | |
|---|---|---|---|---|
| Democratic | Seth Rose | 7,301 | 98.66 | |
| Write-in | 99 | 1.34 | ||
| Total votes | 7,400 | 100.0 | ||
| Democratic hold | ||||
District 73
| Party | Candidate | Votes | % | |
|---|---|---|---|---|
| Democratic | Chris Hart (incumbent) | 8,900 | 77.95 | |
| Republican | Ralph Bell | 2,513 | 22.01 | |
| Write-in | 5 | 0.04 | ||
| Total votes | 11,418 | 100.0 | ||
| Democratic hold | ||||
District 74
| Party | Candidate | Votes | % | |
|---|---|---|---|---|
| Democratic | J. Todd Rutherford (incumbent) | 9,681 | 90.05 | |
| United Citizens | Michael L. Block | 1,018 | 9.47 | |
| Write-in | 52 | 0.48 | ||
| Total votes | 10,751 | 100.0 | ||
| Democratic hold | ||||
District 75
| Party | Candidate | Votes | % | |
|---|---|---|---|---|
| Republican | Kirkman Finlay III (incumbent) | 7,842 | 57.48 | |
| TOTAL | John Crangle | 5,780 | 42.37 | |
| Democratic | John Crangle | 5,594 | 41.01 | |
| American | John Crangle | 186 | 1.36 | |
| Write-in | 20 | 0.15 | ||
| Total votes | 13,642 | 100.0 | ||
| Republican hold | ||||
District 76
| Party | Candidate | Votes | % | |
|---|---|---|---|---|
| Democratic | Leon Howard (incumbent) | 10,639 | 100.0 | |
| Write-in | 88 | 0.82 | ||
| Total votes | 10,727 | 99.18 | ||
| Democratic hold | ||||
District 77
| Party | Candidate | Votes | % | |
|---|---|---|---|---|
| Democratic | Kambrell Garvin | 14,056 | 84.75 | |
| Libertarian | Justin Bishop | 2,445 | 14.74 | |
| Write-in | 85 | 0.51 | ||
| Total votes | 16,586 | 100.0 | ||
| Democratic hold | ||||
District 78
| Party | Candidate | Votes | % | |
|---|---|---|---|---|
| Democratic | Beth Bernstein (incumbent) | 10,178 | 97.87 | |
| Write-in | 222 | 2.13 | ||
| Total votes | 10,400 | 100.0 | ||
| Democratic hold | ||||
District 79
| Party | Candidate | Votes | % | |
|---|---|---|---|---|
| Democratic | Ivory Thigpen (incumbent) | 13,307 | 87.82 | |
| Libertarian | Victor Kocher | 1,782 | 11.76 | |
| Write-in | 63 | 0.43 | ||
| Total votes | 15,152 | 100.0 | ||
| Democratic hold | ||||
District 80
| Party | Candidate | Votes | % | |
|---|---|---|---|---|
| Democratic | Jimmy Bales (incumbent) | 9,722 | 97.94 | |
| Write-in | 204 | 2.06 | ||
| Total votes | 9,926 | 100.0 | ||
| Democratic hold | ||||
District 81
| Party | Candidate | Votes | % | |
|---|---|---|---|---|
| Republican | Bart Blackwell (incumbent) | 11,342 | 62.95 | |
| TOTAL | Elise Fox | 6,667 | 37.0 | |
| Democratic | Elise Fox | 6,317 | 35.06 | |
| Working Families | Elise Fox | 350 | 1.94 | |
| Write-in | 8 | 0.04 | ||
| Total votes | 18,017 | 100.0 | ||
| Republican hold | ||||
District 82
| Party | Candidate | Votes | % | |
|---|---|---|---|---|
| Democratic | William "Bill" Clyburn, Sr. (incumbent) | 8,041 | 96.69 | |
| Write-in | 275 | 3.31 | ||
| Total votes | 8,316 | 100.0 | ||
| Democratic hold | ||||
District 83
| Party | Candidate | Votes | % | |
|---|---|---|---|---|
| Republican | Bill Hixon (incumbent) | 10,414 | 80.44 | |
| Libertarian | David Weikle | 2,431 | 18.78 | |
| Write-in | 102 | 0.79 | ||
| Total votes | 12,947 | 100.0 | ||
| Republican hold | ||||
District 84
| Party | Candidate | Votes | % | |
|---|---|---|---|---|
| Republican | Ronnie Young (incumbent) | 8,270 | 64.76 | |
| Democratic | Jennifer Cook Lariscey | 4,487 | 35.13 | |
| Write-in | 14 | 0.11 | ||
| Total votes | 12,771 | 100.0 | ||
| Republican hold | ||||
District 85
| Party | Candidate | Votes | % | |
|---|---|---|---|---|
| Republican | Chip Huggins (incumbent) | 12,206 | 66.01 | |
| TOTAL | Sam Edwards | 6,273 | 33.93 | |
| Democratic | Sam Edwards | 5,926 | 32.05 | |
| Working Families | Sam Edwards | 347 | 1.88 | |
| Write-in | 12 | 0.06 | ||
| Total votes | 18,491 | 100.0 | ||
| Republican hold | ||||
District 86
| Party | Candidate | Votes | % | |
|---|---|---|---|---|
| Republican | Bill Taylor (incumbent) | 9,703 | 97.75 | |
| Write-in | 223 | 2.25 | ||
| Total votes | 9,923 | 100.0 | ||
| Republican hold | ||||
District 87
| Party | Candidate | Votes | % | |
|---|---|---|---|---|
| Republican | Paula Rawl Calhoon | 13,617 | 73.68 | |
| Democratic | Diane Summers | 4,832 | 26.15 | |
| Write-in | 32 | 0.17 | ||
| Total votes | 18,481 | 100.0 | ||
| Republican hold | ||||
District 88
| Party | Candidate | Votes | % | |
|---|---|---|---|---|
| Republican | McLain "Mac" Toole (incumbent) | 9,872 | 98.24 | |
| Write-in | 177 | 1.76 | ||
| Total votes | 10,049 | 100.0 | ||
| Republican hold | ||||
District 89
| Party | Candidate | Votes | % | |
|---|---|---|---|---|
| Republican | Micah Caskey (incumbent) | 8,861 | 97.34 | |
| Write-in | 242 | 2.66 | ||
| Total votes | 9,103 | 100.0 | ||
| Republican hold | ||||
District 90
| Party | Candidate | Votes | % | |
|---|---|---|---|---|
| Democratic | Justin Bamberg (incumbent) | 7,146 | 96.54 | |
| Write-in | 256 | 3.46 | ||
| Total votes | 7,402 | 100.0 | ||
| Democratic hold | ||||
District 91
| Party | Candidate | Votes | % | |
|---|---|---|---|---|
| Democratic | Lonnie Hosey (incumbent) | 8,768 | 98.78 | |
| Write-in | 108 | 1.22 | ||
| Total votes | 8,876 | 100.0 | ||
| Democratic hold | ||||
District 92
| Party | Candidate | Votes | % | |
|---|---|---|---|---|
| Republican | Joe Daning (incumbent) | 8,874 | 97.03 | |
| Write-in | 272 | 2.97 | ||
| Total votes | 9,146 | 100.0 | ||
| Republican hold | ||||
District 93
| Party | Candidate | Votes | % | |
|---|---|---|---|---|
| Democratic | Russell L. Ott (incumbent) | 8,507 | 65.99 | |
| Republican | Terry L. Kiser, Sr. | 4,381 | 33.98 | |
| Write-in | 4 | 0.03 | ||
| Total votes | 12,892 | 100.0 | ||
| Democratic hold | ||||
District 94
| Party | Candidate | Votes | % | |
|---|---|---|---|---|
| Republican | Con Chellis | 8,458 | 62.93 | |
| Democratic | Damian Daly | 4,968 | 36.96 | |
| Write-in | 14 | 0.10 | ||
| Total votes | 13,440 | 100.0 | ||
| Republican hold | ||||
District 95
| Party | Candidate | Votes | % | |
|---|---|---|---|---|
| Democratic | Jerry Govan (incumbent) | 8,602 | 72.48 | |
| Republican | Chester D. Palmer | 3,258 | 27.45 | |
| Write-in | 8 | 0.07 | ||
| Total votes | 11,868 | 100.0 | ||
| Democratic hold | ||||
District 96
| Party | Candidate | Votes | % | |
|---|---|---|---|---|
| Republican | Kit Spires (incumbent) | 7,040 | 71.73 | |
| Democratic | Bob Vanlue | 2,754 | 28.06 | |
| Write-in | 20 | 0.20 | ||
| Total votes | 9,814 | 100.0 | ||
| Republican hold | ||||
District 97
| Party | Candidate | Votes | % | |
|---|---|---|---|---|
| Republican | Mandy W. Kimmons | 7,746 | 53.86 | |
| Democratic | Patsy G. Knight (incumbent) | 6,629 | 46.10 | |
| Write-in | 6 | 0.04 | ||
| Total votes | 14,381 | 100.0 | ||
| Republican gain from Democratic | ||||
District 98
| Party | Candidate | Votes | % | |
|---|---|---|---|---|
| Republican | Chris Murphy (incumbent) | 9,179 | 96.12 | |
| Write-in | 371 | 3.88 | ||
| Total votes | 9,550 | 100.0 | ||
| Republican hold | ||||
District 99
| Party | Candidate | Votes | % | |
|---|---|---|---|---|
| Republican | Nancy Mace (incumbent) | 10,836 | 60.97 | |
| TOTAL | Jen Gibson | 6,927 | 38.98 | |
| Democratic | Jen Gibson | 6,590 | 37.08 | |
| Working Families | Jen Gibson | 337 | 1.90 | |
| Write-in | 9 | 0.05 | ||
| Total votes | 17,772 | 100.0 | ||
| Republican hold | ||||
District 100
| Party | Candidate | Votes | % | |
|---|---|---|---|---|
| Republican | Sylleste H. Davis (incumbent) | 10,809 | 62.52 | |
| Democratic | Michael W. Yates | 6,353 | 36.75 | |
| Write-in | 127 | 0.73 | ||
| Total votes | 17,289 | 100.0 | ||
| Republican hold | ||||
District 101
| Party | Candidate | Votes | % | |
|---|---|---|---|---|
| Democratic | Cezar McKnight (incumbent) | 8,759 | 96.40 | |
| Write-in | 327 | 3.60 | ||
| Total votes | 9,086 | 100.0 | ||
| Democratic hold | ||||
District 102
| Party | Candidate | Votes | % | |
|---|---|---|---|---|
| Democratic | Joe Jefferson (incumbent) | 7,480 | 60.92 | |
| Republican | Terry Hardesty | 4,788 | 38.99 | |
| Write-in | 11 | 0.09 | ||
| Total votes | 12,279 | 100.0 | ||
| Democratic hold | ||||
District 103
| Party | Candidate | Votes | % | |
|---|---|---|---|---|
| Democratic | Carl L. Anderson (incumbent) | 9,078 | 98.27 | |
| Write-in | 160 | 1.73 | ||
| Total votes | 9,238 | 100.0 | ||
| Democratic hold | ||||
District 104
| Party | Candidate | Votes | % | |
|---|---|---|---|---|
| Republican | William Bailey | 14,859 | 98.38 | |
| Write-in | 244 | 1.62 | ||
| Total votes | 15,103 | 100.0 | ||
| Republican hold | ||||
District 105
| Party | Candidate | Votes | % | |
|---|---|---|---|---|
| Republican | Kevin Hardee (incumbent) | 8,965 | 97.99 | |
| Write-in | 184 | 2.01 | ||
| Total votes | 9,149 | 100.0 | ||
| Republican hold | ||||
District 106
| Party | Candidate | Votes | % | |
|---|---|---|---|---|
| Republican | Russell Fry (incumbent) | 13,198 | 68.38 | |
| TOTAL | Robin Gause | 6,088 | 31.54 | |
| Democratic | Robin Gause | 5,779 | 29.94 | |
| Working Families | Robin Gause | 182 | 0.94 | |
| American | Robin Gause | 127 | 0.66 | |
| Write-in | 14 | 0.07 | ||
| Total votes | 19,300 | 100.0 | ||
| Republican hold | ||||
District 107
| Party | Candidate | Votes | % | |
|---|---|---|---|---|
| Republican | Alan Clemmons (incumbent) | 10,617 | 97.49 | |
| Write-in | 273 | 2.51 | ||
| Total votes | 10,890 | 100.0 | ||
| Republican hold | ||||
District 108
| Party | Candidate | Votes | % | |
|---|---|---|---|---|
| Republican | Lee Hewitt (incumbent) | 14,450 | 98.47 | |
| Write-in | 224 | 1.53 | ||
| Total votes | 14,674 | 100.0 | ||
| Republican hold | ||||
District 109
| Party | Candidate | Votes | % | |
|---|---|---|---|---|
| Democratic | David Mack III (incumbent) | 7,473 | 80.81 | |
| Working Families | David Mack III (incumbent) | 616 | 6.66 | |
| TOTAL | David Mack III (incumbent) | 8,089 | 87.47 | |
| Libertarian | Rodney Travis | 1,129 | 12.21 | |
| Write-in | 30 | 0.35 | ||
| Total votes | 9,248 | 100.0 | ||
| Democratic hold | ||||
District 110
| Party | Candidate | Votes | % | |
|---|---|---|---|---|
| Republican | William S. Cogswell, Jr. (incumbent) | 9,264 | 55.07 | |
| Democratic | Ben Pogue | 7,548 | 44.87 | |
| Write-in | 9 | 0.05 | ||
| Total votes | 16,821 | 100.0 | ||
| Republican hold | ||||
District 111
| Party | Candidate | Votes | % | |
|---|---|---|---|---|
| Democratic | Wendell G. Gilliard (incumbent) | 10,011 | 98.43 | |
| Write-in | 460 | 1.57 | ||
| Total votes | 10,171 | 100.0 | ||
| Democratic hold | ||||
District 112
| Party | Candidate | Votes | % | |
|---|---|---|---|---|
| Republican | Mike Sottile (incumbent) | 12,210 | 57.31 | |
| TOTAL | Joe Preston | 9,084 | 42.64 | |
| Democratic | Joe Preston | 8,712 | 40.89 | |
| Working Families | Joe Preston | 372 | 1.75 | |
| Write-in | 13 | 0.06 | ||
| Total votes | 21,307 | 100.0 | ||
| Republican hold | ||||
District 113
| Party | Candidate | Votes | % | |
|---|---|---|---|---|
| Democratic | Marvin R. Pendarvis (incumbent) | 8,256 | 98.49 | |
| Write-in | 127 | 1.51 | ||
| Total votes | 8,383 | 100.0 | ||
| Democratic hold | ||||
District 114
| Party | Candidate | Votes | % | |
|---|---|---|---|---|
| Republican | Lin Bennett (incumbent) | 8,619 | 52.52 | |
| Democratic | Dan P. Jones | 7,153 | 43.59 | |
| Libertarian | Melissa Couture | 633 | 3.86 | |
| Write-in | 6 | 0.04 | ||
| Total votes | 16,411 | 100.0 | ||
| Republican hold | ||||
District 115
| Party | Candidate | Votes | % | |
|---|---|---|---|---|
| Republican | Peter McCoy (incumbent) | 9,727 | 51.45 | |
| TOTAL | Carol Tempel | 9,173 | 48.52 | |
| Democratic | Carol Tempel | 8,776 | 46.42 | |
| Working Families | Carol Tempel | 397 | 2.10 | |
| Write-in | 6 | 0.03 | ||
| Total votes | 18,906 | 100.0 | ||
| Republican hold | ||||
District 116
| Party | Candidate | Votes | % | |
|---|---|---|---|---|
| Democratic | Robert L. Brown (incumbent) | 8,699 | 54.04 | |
| Working Families | Robert L. Brown (incumbent) | 329 | 2.04 | |
| TOTAL | Robert L. Brown (incumbent) | 9,028 | 56.08 | |
| Republican | Carroll O'Neal | 7,065 | 4389 | |
| Write-in | 4 | 0.02 | ||
| Total votes | 16,097 | 100.0 | ||
| Democratic hold | ||||
District 117
| Party | Candidate | Votes | % | |
|---|---|---|---|---|
| Democratic | Krystle N. Simmons | 5,577 | 53.45 | |
| Republican | Bill Crosby (incumbent) | 4,842 | 46.41 | |
| Write-in | 15 | 0.14 | ||
| Total votes | 10,434 | 100.0 | ||
| Democratic gain from Republican | ||||
District 118
| Party | Candidate | Votes | % | |
|---|---|---|---|---|
| Republican | Bill Herbkersman (incumbent) | 12,175 | 97.98 | |
| Write-in | 251 | 2.02 | ||
| Total votes | 12,426 | 100.0 | ||
| Republican hold | ||||
District 119
| Party | Candidate | Votes | % | |
|---|---|---|---|---|
| Democratic | Leonidas "Leon" Stavrinakis (incumbent) | 11,172 | 64.98 | |
| Republican | Paul Sizemore | 6,011 | 34.96 | |
| Write-in | 11 | 0.06 | ||
| Total votes | 17,194 | 100.0 | ||
| Democratic hold | ||||
District 120
| Party | Candidate | Votes | % | |
|---|---|---|---|---|
| Republican | Weston Newton (incumbent) | 10,806 | 64.12 | |
| Democratic | Ryan Martz | 6,039 | 35.83 | |
| Write-in | 8 | 0.05 | ||
| Total votes | 16,853 | 100.0 | ||
| Republican hold | ||||
District 121
| Party | Candidate | Votes | % | |
|---|---|---|---|---|
| Democratic | Michael F. Rivers, Sr. (incumbent) | 9,440 | 97.92 | |
| Write-in | 201 | 2.08 | ||
| Total votes | 9,641 | 100.0 | ||
| Democratic hold | ||||
District 122
| Party | Candidate | Votes | % | |
|---|---|---|---|---|
| Democratic | Shedron Williams | 7,509 | 80.70 | |
| Write-in | 1796 | 19.30 | ||
| Total votes | 9,305 | 100.0 | ||
| Democratic hold | ||||
District 123
| Party | Candidate | Votes | % | |
|---|---|---|---|---|
| Republican | Jeff Bradley (incumbent) | 10,781 | 61.98 | |
| Democratic | Mario Martinez | 6,594 | 37.91 | |
| Write-in | 19 | 0.11 | ||
| Total votes | 17,394 | 100.0 | ||
| Republican hold | ||||
District 124
| Party | Candidate | Votes | % | |
|---|---|---|---|---|
| Republican | Shannon Erickson (incumbent) | 10,401 | 97.43 | |
| Write-in | 274 | 2.57 | ||
| Total votes | 10,675 | 100.0 | ||
| Republican hold | ||||
See also
- United States elections, 2018
- United States House of Representatives elections in South Carolina, 2018
- South Carolina gubernatorial election, 2018
- South Carolina elections, 2018
- South Carolina Attorney General, 2018
- South Carolina Secretary of State, 2018
- South Carolina Treasurer, 2018
- South Carolina Comptroller General, 2018
- South Carolina Superintendent of Education, 2018
- South Carolina Commissioner of Agriculture, 2018
- South Carolina Adjutant General, 2018
References
- 1 2 "Official Results". South Carolina Secretary of State. Retrieved February 22, 2019.
- ↑ "South Carolina House of Representatives elections, 2018". Ballotpedia. Retrieved February 22, 2019.
- ↑ "South Carolina House of Representatives elections, 2018". Ballotpedia. Retrieved February 22, 2019.
- ↑ "Official Results". South Carolina Secretary of State. Retrieved February 22, 2019.