| |||||||||||||||||||||||||||||
All 68 seats to Aberdeenshire Council 35 seats needed for a majority | |||||||||||||||||||||||||||||
|---|---|---|---|---|---|---|---|---|---|---|---|---|---|---|---|---|---|---|---|---|---|---|---|---|---|---|---|---|---|
| |||||||||||||||||||||||||||||
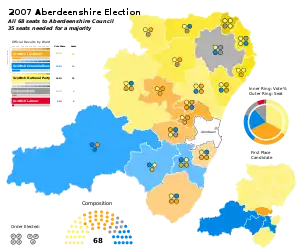 2007 Aberdeenshire Council Election Results Map | |||||||||||||||||||||||||||||
Elections to Aberdeenshire Council were held on 3 May 2007 the same day as the other Scottish local government elections and the Scottish Parliament general election. The election was the first one using 19 new wards created as a result of the Local Governance (Scotland) Act 2004, each ward would elect three or four councillors using the single transferable vote system form of proportional representation. The new wards replaced 68 single-member wards which used the plurality (first past the post) system of election.
The council remained under no overall control and a coalition was formed between the Liberal Democrats and the Conservatives.
Results
Votes are the first preference votes.
| Party | Seats | Gains | Losses | Net gain/loss | Seats % | Votes % | Votes | +/− | |
|---|---|---|---|---|---|---|---|---|---|
| Liberal Democrats | 24 | N/A | N/A | –4 | 35.3 | 25.2 | 24,175 | ||
| SNP | 22 | N/A | N/A | +7 | 32.4 | 34.5 | 33,120 | ||
| Conservative | 14 | N/A | N/A | +3 | 20.6 | 20.8 | 19,946 | ||
| Labour | 0 | N/A | N/A | ±0 | 0.0 | 5.4 | 5,189 | ||
| Scottish Green | 0 | N/A | N/A | ±0 | 0.0 | 1.1 | 1,097 | ||
| Solidarity | 0 | N/A | N/A | ±0 | 0.0 | 0.1 | 112 | ||
| BNP | 0 | N/A | N/A | ±0 | 0.0 | 0.1 | 87 | ||
| Independent | 8 | N/A | N/A | –6 | 11.8 | 12.7 | 12,182 | ||
Ward results
Banff and District (3 seats)
| Party | Candidate | FPv% | Count | ||||||||
|---|---|---|---|---|---|---|---|---|---|---|---|
| 1 | 2 | 3 | 4 | 5 | 6 | 7 | 8 | ||||
| SNP | Ian Gray | 24.0 | 1,088 | 1,092 | 1,103 | 1,142 | |||||
| Liberal Democrats | Jack Mair | 15.3 | 694 | 704 | 713 | 773 | 773 | 848 | 915 | 1,132 | |
| Independent | John Cox†††††††† | 15.2 | 691 | 707 | 742 | 791 | 791 | 925 | 1,055 | 1,257 | |
| Conservative | Neil Chalmers | 13.6 | 616 | 626 | 640 | 666 | 666 | 741 | 792 | ||
| SNP | Kathryn Parr | 11.0 | 500 | 509 | 525 | 554 | 558 | 609 | |||
| Independent | Sandy Buchan | 8.4 | 383 | 398 | 438 | 475 | 475 | ||||
| Scottish Green | Jonny Barton | 6.6 | 298 | 301 | 319 | ||||||
| Independent | John Calder | 3.8 | 172 | 180 | |||||||
| Independent | Ian Page | 2.1 | 94 | ||||||||
| Electorate: 8,815 Valid: 4,536 Spoilt: 105 Quota: 1,135 Turnout: 53.11% | |||||||||||
Troup (3 seats)
| Party | Candidate | FPv% | Count | ||
|---|---|---|---|---|---|
| 1 | 2 | ||||
| SNP | Mitchell Burnett | 47.7 | 1,798 | ||
| Conservative | John Duncan | 24.3 | 914 | 1,060 | |
| Independent | Sydney Mair | 20.4 | 770 | 975 | |
| Liberal Democrats | Ian Findlay | 7.6 | 286 | 422 | |
| Electorate: 7,563 Valid: 3,768 Spoilt: 53 Quota: 943 Turnout: 50.91% | |||||
Fraserburgh and District (4 seats)
| Party | Candidate | FPv% | Count | |||||||
|---|---|---|---|---|---|---|---|---|---|---|
| 1 | 2 | 3 | 4 | 5 | 6 | 7 | ||||
| SNP | Brian Topping | 27.1 | 1,487 | |||||||
| SNP | Ian Tait† | 20.6 | 1,131 | |||||||
| Independent | Michael Watt | 15.1 | 831 | 865 | 869 | 890 | 918 | 1,041 | 1,370 | |
| SNP | Andy Ritchie†††††† | 14.5 | 795 | 1,022 | 1,037 | 1,046 | 1,060 | 1,090 | 1,165 | |
| Independent | Dennis Duthie | 9.3 | 509 | 520 | 522 | 554 | 587 | 728 | ||
| Conservative | Bob Sim | 8.5 | 466 | 482 | 484 | 490 | 522 | |||
| Liberal Democrats | Dominique-Paul Lonchay | 3.0 | 164 | 167 | 168 | 171 | ||||
| Independent | James Milne | 2.0 | 109 | 116 | 116 | |||||
| Electorate: 11,011 Valid: 5,492 Spoilt: 168 Quota: 1,099 Turnout: 51.83% | ||||||||||
Central Buchan (4 seats)
| Party | Candidate | FPv% | Count | ||||||||
|---|---|---|---|---|---|---|---|---|---|---|---|
| 1 | 2 | 3 | 4 | 5 | 6 | 7 | 8 | ||||
| SNP | Sandy Stronach | 20.2 | 1,096 | ||||||||
| Independent | Norman Smith | 19.4 | 1,054 | 1,054 | 1,080 | 1,142 | |||||
| Conservative | Peter Chapman | 17.2 | 933 | 933 | 974 | 1,022 | 1,031 | 1,087 | |||
| Independent | Albert Howe | 14.6 | 790 | 790 | 822 | 911 | 933 | 1,016 | 1,016 | 1,283 | |
| SNP | Norma Thomson | 13.2 | 718 | 726 | 771 | 804 | 812 | 870 | 870 | ||
| Labour | Carol Donald | 5.9 | 318 | 318 | 363 | 378 | 381 | ||||
| Independent | Jim Conn | 4.9 | 265 | 265 | 290 | ||||||
| Liberal Democrats | Betty May | 4.7 | 253 | 253 | |||||||
| Electorate: 10,020 Valid: 5,427 Spoilt: 91 Quota: 1,086 Turnout: 55.42% | |||||||||||
Peterhead North and Rattray (4 seats)
| Party | Candidate | FPv% | Count | |||||||
|---|---|---|---|---|---|---|---|---|---|---|
| 1 | 2 | 3 | 4 | 5 | 6 | 7 | ||||
| SNP | Anne Allan | 22.4 | 1,018 | |||||||
| Independent | Alan Buchan | 20.9 | 948 | 948 | ||||||
| SNP | Fiona McRae | 15.0 | 682 | 696 | 699 | 713 | 735 | 763 | 1,316 | |
| Conservative | Robert Thomas | 14.4 | 655 | 655 | 659 | 667 | 704 | 803 | 819 | |
| SNP | Sandy Allan | 12.9 | 585 | 666 | 671 | 685 | 718 | 752 | ||
| Liberal Democrats | Andrew Hassan | 6.3 | 288 | 290 | 292 | 304 | 356 | |||
| Independent | Ian Cowie | 5.6 | 256 | 257 | 265 | 289 | ||||
| Solidarity | Steven Will | 2.5 | 112 | 113 | 115 | |||||
| Electorate: 10,274 Valid: 4,544 Spoilt: 150 Quota: 909 Turnout: 46.04% | ||||||||||
Peterhead South and Cruden (3 seats)
| Party | Candidate | FPv% | Count | |||||
|---|---|---|---|---|---|---|---|---|
| 1 | 2 | 3 | 4 | 5 | ||||
| SNP | Stephen Smith | 29.4 | 1,205 | |||||
| SNP | Stuart Pratt | 21.6 | 888 | 1,016 | 1,032 | |||
| Liberal Democrats | Sam Coull†††† | 21.0 | 861 | 870 | 894 | 895 | 1,032 | |
| Independent | Raymond Matthew | 13.0 | 535 | 542 | 637 | 638 | 767 | |
| Conservative | Steven Owen | 10.3 | 422 | 425 | 443 | 443 | ||
| Independent | Veronica Johnston | 4.7 | 193 | 196 | ||||
| Electorate: 8,813 Valid: 4,104 Spoilt: 108 Quota: 1,027 Turnout: 48.11% | ||||||||
Turriff and District (3 seats)
| Party | Candidate | FPv% | Count | |||||
|---|---|---|---|---|---|---|---|---|
| 1 | 2 | 3 | 4 | 5 | ||||
| SNP | Sandy Duncan | 41.9 | 1,916 | |||||
| Conservative | Alistair Duffus Strachan | 17.4 | 796 | 882 | 901 | 932 | ||
| Liberal Democrats | Anne Robertson | 17.3 | 790 | 948 | 962 | 1,071 | 1,372 | |
| Independent | Alisan Norrie | 16.4 | 748 | 900 | 935 | 971 | 1,304 | |
| Labour | Ann Marie Sheal | 5.1 | 232 | 270 | 279 | |||
| BNP | Gary Raikes | 1.9 | 87 | 119 | ||||
| Electorate: 8,679 Valid: 4,569 Spoilt: 52 Quota: 1,143 Turnout: 53.53% | ||||||||
Mid-Formartine (4 seats)
| Party | Candidate | FPv% | Count | |||||
|---|---|---|---|---|---|---|---|---|
| 1 | 2 | 3 | 4 | 5 | ||||
| SNP | Allan Hendry | 33.6 | 2,035 | |||||
| Liberal Democrats | Paul Johnston††††† | 27.4 | 1,661 | |||||
| Conservative | Jim Gifford | 17.1 | 1,034 | 1,141 | 1,182 | 1,261 | ||
| Liberal Democrats | John Kevin Loveday | 11.2 | 677 | 855 | 1,134 | 1,210 | 1,227 | |
| Labour | Steve Thomson | 7.7 | 469 | 558 | 586 | 613 | 618 | |
| Independent | Howard Kershaw | 3.1 | 188 | 290 | 306 | |||
| Electorate: 11,047 Valid: 6,064 Spoilt: 59 Quota: 1,213 Turnout: 55.91% | ||||||||
Ellon and District (4 seats)
| Party | Candidate | FPv% | Count | |||||
|---|---|---|---|---|---|---|---|---|
| 1 | 2 | 3 | 4 | 5 | ||||
| SNP | Rob Merson | 40.5 | 2,458 | |||||
| Liberal Democrats | Isobel Davidson | 23.2 | 1,407 | |||||
| Conservative | Gillian Louise Owen | 14.4 | 872 | 1,033 | 1,053 | 1,197 | 1,274 | |
| Liberal Democrats | Debra Margaret Storr†† | 8.6 | 524 | 777 | 899 | 1,049 | 1,326 | |
| Labour | Ann Thorpe | 7.5 | 456 | 587 | 599 | 648 | ||
| Independent | Diane Ripley | 5.8 | 352 | 542 | 555 | |||
| Electorate: 11,186 Valid: 6,069 Spoilt: 69 Quota: 1,214 Turnout: 55.37% | ||||||||
West Garioch (3 seats)
| Party | Candidate | FPv% | Count | ||||||
|---|---|---|---|---|---|---|---|---|---|
| 1 | 2 | 3 | 4 | 5 | 6 | ||||
| SNP | Alison Grant | 35.5 | 1,555 | ||||||
| Liberal Democrats | Sheena Margaret Lonchay | 22.2 | 973 | 1,063 | 1,085 | 1,169 | |||
| Liberal Democrats | Hazel Al-Kowarri | 18.4 | 807 | 884 | 899 | 981 | 1,027 | 1,358 | |
| Conservative | David Clucas | 15.8 | 694 | 746 | 775 | 821 | 830 | ||
| Labour | Ricky Simpson | 6.0 | 263 | 293 | 303 | ||||
| Independent | Terry Rigby | 2.1 | 93 | 125 | |||||
| Electorate: 8,036 Valid: 4,385 Spoilt: 58 Quota: 1,097 Turnout: 55.68% | |||||||||
Inverurie and District (4 seats)
| Party | Candidate | FPv% | Count | ||||||
|---|---|---|---|---|---|---|---|---|---|
| 1 | 2 | 3 | 4 | 5 | 6 | ||||
| SNP | Bryan Hunter Stuart | 29.6 | 1,515 | ||||||
| Liberal Democrats | Mike Raeburn | 25.7 | 1,316 | ||||||
| Liberal Democrats | Martin Kitts-Hayes | 16.9 | 865 | 975 | 1,172 | ||||
| Conservative | Richard Cowling | 14.9 | 762 | 823 | 837 | 864 | 928 | 1,190 | |
| Labour | Ellis Thorpe | 11.1 | 567 | 637 | 659 | 693 | 737 | ||
| Independent | John Sangster | 1.7 | 87 | 165 | 175 | 192 | |||
| Electorate: 9,361 Valid: 5,148 Spoilt: 86 Quota: 1,030 Turnout: 56.32% | |||||||||
East Garioch (3 seats)
| Party | Candidate | FPv% | Count | ||||
|---|---|---|---|---|---|---|---|
| 1 | 2 | 3 | 4 | ||||
| SNP | Fergie Hood | 31.9 | 1,420 | ||||
| Liberal Democrats | Martin Anthony Ford††† | 23.7 | 1,054 | 1,118 | |||
| Liberal Democrats | Nan Cullinane | 21.8 | 968 | 1,025 | 1,030 | 1,206 | |
| Conservative | Gordon Naismith | 15.5 | 687 | 726 | 726 | 769 | |
| Labour | Sheila Henderson | 7.1 | 317 | 345 | 345 | ||
| Electorate: 8,185 Valid: 4,446 Spoilt: 56 Quota: 1,112 Turnout: 54.94% | |||||||
Westhill and District (4 seats)
| Party | Candidate | FPv% | Count | ||||||
|---|---|---|---|---|---|---|---|---|---|
| 1 | 2 | 3 | 4 | 5 | 6 | ||||
| Liberal Democrats | Gurudeo Singh Saluja | 27.3 | 1,558 | ||||||
| Conservative | Ron McKail | 22.9 | 1,306 | ||||||
| SNP | Amanda Allan | 21.6 | 1,230 | ||||||
| Independent | Mark Cullen†††††††† | 14.8 | 845 | 896 | 945 | 967 | 1,031 | 1,407 | |
| Liberal Democrats | Sheila Thomson | 8.1 | 460 | 736 | 774 | 794 | 935 | ||
| Labour | Ona Ramsay | 5.3 | 301 | 325 | 333 | 344 | |||
| Electorate: 10,567 Valid: 5,700 Spoilt: 39 Quota: 1,141 Turnout: 55.00% | |||||||||
Huntly, Strathbogie and Howe of Alford (4 seats)
| Party | Candidate | FPv% | Count | |||||||
|---|---|---|---|---|---|---|---|---|---|---|
| 1 | 2 | 3 | 4 | 5 | 6 | 7 | ||||
| SNP | Joanna Strathdee | 30.7 | 1,839 | |||||||
| Conservative | Moira Ingleby | 27.3 | 1,635 | |||||||
| Liberal Democrats | Richard C Stroud | 16.4 | 978 | 1,077 | 1,145 | 1,170 | 1,280 | |||
| Liberal Democrats | Alistair Ross | 13.6 | 812 | 907 | 979 | 1,012 | 1,088 | 1,143 | 1,378 | |
| Labour | Bryan Begg | 6.3 | 375 | 424 | 444 | 456 | 501 | 508 | ||
| Scottish Green | Jake Williams | 4.2 | 251 | 340 | 376 | 421 | ||||
| Independent | David Hutchison | 1.5 | 91 | 135 | 177 | |||||
| Electorate: 11,162 Valid: 5,981 Spoilt: 82 Quota: 1,197 Turnout: 54.68% | ||||||||||
Aboyne, Upper Deeside and Donside (3 seats)
| Party | Candidate | FPv% | Count | |||||
|---|---|---|---|---|---|---|---|---|
| 1 | 2 | 3 | 4 | 5 | ||||
| Conservative | Marcus Humphrey | 29.3 | 1,444 | |||||
| Liberal Democrats | Peter Argyle | 26.1 | 1,286 | |||||
| Conservative | Bruce Luffman | 20.5 | 1,009 | 1,160 | 1,172 | 1,218 | 1,625 | |
| SNP | Carol Douglas | 20.1 | 991 | 1,009 | 1,021 | 1,078 | ||
| Labour | Angus Murdoch | 4.0 | 196 | 202 | 213 | |||
| Electorate: 8,467 Valid: 4,926 Spoilt: 75 Quota: 1,232 Turnout: 59.51% | ||||||||
Banchory and Mid-Deeside (3 seats)
| Party | Candidate | FPv% | Count | |||||
|---|---|---|---|---|---|---|---|---|
| 1 | 2 | 3 | 4 | 5 | ||||
| Conservative | Jill Webster | 35.6 | 1,570 | |||||
| SNP | Linda Clark | 24.2 | 1,068 | 1,140 | ||||
| Liberal Democrats | Karen Clark | 18.0 | 795 | 876 | 885 | 1,029 | 1,691 | |
| Liberal Democrats | Jean Henretty | 15.3 | 300 | 790 | 798 | 857 | ||
| Labour | Andy Brown | 6.8 | 300 | 326 | 331 | |||
| Electorate: 7,996 Valid: 4,409 Spoilt: 46 Quota: 1,103 Turnout: 56.32% | ||||||||
North Kincardine (4 seats)
| Party | Candidate | FPv% | Count | |||||||
|---|---|---|---|---|---|---|---|---|---|---|
| 1 | 2 | 3 | 4 | 5 | 6 | 7 | ||||
| SNP | Alastair Bews | 27.8 | 1,426 | |||||||
| Conservative | Carl H Nelson | 18.4 | 946 | 972 | 1,008 | 1,065 | ||||
| Liberal Democrats | Paul Melling | 16.8 | 864 | 957 | 978 | 1,124 | ||||
| Liberal Democrats | Ian Mollison | 12.1 | 619 | 652 | 689 | 799 | 863 | 875 | 1,119 | |
| Independent | Henry Irvine-Fortescue | 11.2 | 575 | 613 | 659 | 707 | 713 | 723 | ||
| Labour | Jim Milne | 10.5 | 540 | 586 | 596 | |||||
| Independent | Michelle Reid-Hay | 3.2 | 162 | 194 | ||||||
| Electorate: 9,980 Valid: 5,132 Spoilt: 37 Quota: 1,027 Turnout: 52.36% | ||||||||||
Stonehaven and Lower Deeside (4 seats)
| Party | Candidate | FPv% | Count | |||||||||||
|---|---|---|---|---|---|---|---|---|---|---|---|---|---|---|
| 1 | 2 | 3 | 4 | 5 | 6 | 7 | 8 | 9 | 10 | 11 | ||||
| Conservative | Wendy Agnew | 24.9 | 1,433 | |||||||||||
| SNP | Graeme Clark | 18.9 | 1,086 | 1,107 | 1,112 | 1,117 | 1,126 | 1,154 | ||||||
| Liberal Democrats | Mike Sullivan | 11.0 | 636 | 656 | 657 | 668 | 684 | 700 | 701 | 741 | 797 | 931 | 1,105 | |
| Conservative | Sandy Wallace | 10.9 | 629 | 730 | 735 | 737 | 751 | 760 | 760 | 779 | 823 | 853 | ||
| Liberal Democrats | Peter Bellarby | 9.8 | 563 | 590 | 596 | 605 | 620 | 633 | 633 | 723 | 780 | 880 | 980 | |
| Labour | Bridget O'Hare | 8.0 | 463 | 470 | 473 | 479 | 482 | 493 | 493 | 524 | 558 | |||
| Independent | Bob Michie | 4.9 | 282 | 299 | 314 | 333 | 366 | 430 | 430 | 470 | ||||
| Scottish Green | Karen Anne Allan | 4.2 | 242 | 253 | 258 | 264 | 272 | 285 | 286 | |||||
| Independent | George Alexander Forbes Emslie | 2.8 | 160 | 177 | 182 | 189 | 201 | |||||||
| Independent | Ken Venters | 1.9 | 108 | 116 | 132 | 139 | ||||||||
| Independent | Dermot John Hearty | 1.5 | 85 | 87 | 89 | |||||||||
| Independent | David Wood | 1.3 | 73 | 79 | ||||||||||
| Electorate: 10,770 Valid: 5,760 Spoilt: 90 Quota: 1,153 Turnout: 54.79% | ||||||||||||||
Mearns (4 seats)
| Party | Candidate | FPv% | Count | ||||||||
|---|---|---|---|---|---|---|---|---|---|---|---|
| 1 | 2 | 3 | 4 | 5 | 6 | 7 | 8 | ||||
| SNP | Jean Dick | 23.0 | 1,262 | ||||||||
| Conservative | George Carr | 20.5 | 1,123 | ||||||||
| Liberal Democrats | Tom Fleming | 16.6 | 909 | 940 | 945 | 1,046 | 1,144 | ||||
| Liberal Democrats | Bill Howatson | 13.8 | 759 | 775 | 778 | 815 | 850 | 879 | 1,021 | 1,291 | |
| Labour | Gill Bayfield | 7.1 | 392 | 406 | 407 | 442 | 455 | 459 | |||
| Independent | David Nelson | 7.1 | 391 | 404 | 407 | 432 | 596 | 601 | 659 | ||
| Independent | Robert Gairn Davidson | 6.2 | 342 | 355 | 358 | 403 | |||||
| Scottish Green | Kate Anderson | 5.6 | 306 | 336 | 338 | ||||||
| Electorate: 10,436 Valid: 5,484 Spoilt: 48 Quota: 1,097 Turnout: 53.28% | |||||||||||
Changes Since 2007 Elections
- †Cllr Ian Tait resigned from the SNP on 28 July 2008 and now sits as an Independent Scottish Nationalist.
- ††Cllr Debra Storr resigned from the Liberal Democrats on 18 November 2008 and on 5 March 2009 she joined the Scottish Green Party. She was a member of the Democratic Independent Group on the council.
- †††Cllr Martin Ford resigned from the Liberal Democrats on 23 November 2008 and on 5 March 2009 he joined the Scottish Green Party. He is a member of the Democratic Independent Group on the council.
- ††††On 23 January 2009, Cllr Sam Coull resigned from the Liberal Democrats. Since 5 March 2009 he sits as a member of the Democratic Independent Group
- †††††On 23 January 2009, Cllr Paul Johnston left the Liberal Democrat Council Group. He was subsequently expelled from the Liberal Democrats. Since 5 March 2009 he sits as a member of the Democratic Independent Group.
- ††††††Cllr Andy Ritchie resigned from the SNP on 1 April 2009 and now sits as an Independent.
- †††††††Cllr Mark Cullen is also a member of the Democratic Independent Group on the council.
- ††††††††On 21 February 2012 Banff and District Cllr John Cox ceased to be an Independent and joined the Scottish National Party.
By-elections (2007-12)
- There was a Troup by-election held on 1 May 2008 to fill the vacancy which arose with the death of the SNP's Michael Burnett on 4 February 2008. The by-election was won by the SNP's Bob Watson on 1 May 2008
| Party | Candidate | FPv% | Count | ||
|---|---|---|---|---|---|
| 1 | |||||
| SNP | Bob Watson | 62.83 | 1,721 | ||
| Conservative | Lisa Watt | 18.80 | 515 | ||
| Liberal Democrats | Edward Acton | 18.36 | 503 | ||
| SNP hold | Swing | ||||
| Electorate: 7,589 Valid: 2,739 Spoilt: 16 Quota: 1,371 Turnout: 2,755 (36.3%) | |||||
- There was an Aboyne, Upper Deeside and Donside by-election held on 23 April 2009 to fill the vacancy which arose with the resignation of the Conservative's Bruce Luffman in 2009. The by-election was won by the Liberal Democrat's Rosemary Bruce on 23 April 2009
| Party | Candidate | FPv% | Count | |||||
|---|---|---|---|---|---|---|---|---|
| 1 | 2 | 3 | 4 | 5 | ||||
| Conservative | Jo Pick | 31.47 | 1,144 | 1,148 | 1,152 | 1,241 | 1,468 | |
| Liberal Democrats | Rosemary Bruce | 26.66 | 969 | 975 | 981 | 1,180 | 1,566 | |
| Independent | William Forbes | 23.16 | 842 | 845 | 855 | 1,003 | ||
| SNP | George Parkinson | 16.97 | 617 | 621 | 636 | |||
| BNP | Roy Jones | 1.21 | 44 | 44 | ||||
| Independent | David Hutchison | 0.52 | 19 | |||||
| Liberal Democrats gain from Conservative | Swing | |||||||
| Electorate: 8,357 Valid: 3,635 Spoilt: 20 Quota: 1,819 Turnout: 3,655 (43.7%) | ||||||||
Footnotes
- ↑ "Archived copy" (PDF). Archived from the original (PDF) on 16 March 2012. Retrieved 20 May 2011.
{{cite web}}: CS1 maint: archived copy as title (link) - ↑ "Archived copy" (PDF). Archived from the original (PDF) on 16 March 2012. Retrieved 20 May 2011.
{{cite web}}: CS1 maint: archived copy as title (link)
External links
This article is issued from Wikipedia. The text is licensed under Creative Commons - Attribution - Sharealike. Additional terms may apply for the media files.