| ||||||||||||||||||||||||||||||||||||||||||||||||||
All 90 seats in the National Assembly 46 seats needed for a majority | ||||||||||||||||||||||||||||||||||||||||||||||||||
| Turnout | 70.09% ( | |||||||||||||||||||||||||||||||||||||||||||||||||
|---|---|---|---|---|---|---|---|---|---|---|---|---|---|---|---|---|---|---|---|---|---|---|---|---|---|---|---|---|---|---|---|---|---|---|---|---|---|---|---|---|---|---|---|---|---|---|---|---|---|---|
This lists parties that won seats. See the complete results below.
| ||||||||||||||||||||||||||||||||||||||||||||||||||
 |
|---|
|
UN Member State |
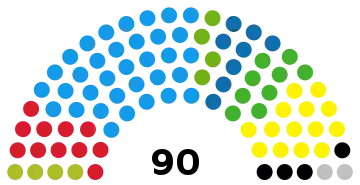
Parliamentary elections were held in Slovenia on 15 October 2000, after a successful vote of no confidence defeated the government of Andrej Bajuk.[1] The result was a victory for Liberal Democracy of Slovenia, which won 34 of the 90 seats. Following the election, Liberal Democracy leader Janez Drnovšek returned to the post of Prime Minister.
Results
 | |||||
|---|---|---|---|---|---|
| Party | Votes | % | Seats | +/– | |
| Liberal Democracy of Slovenia | 390,306 | 36.26 | 34 | +9 | |
| Slovenian Democratic Party | 170,228 | 15.81 | 14 | –2 | |
| United List of Social Democrats | 130,079 | 12.08 | 11 | +2 | |
| Slovenian People's Party–Slovene Christian Democrats | 102,691 | 9.54 | 9 | –20 | |
| New Slovenia | 93,247 | 8.66 | 8 | New | |
| Democratic Party of Pensioners of Slovenia | 55,634 | 5.17 | 4 | –1 | |
| Slovenian National Party | 47,214 | 4.39 | 4 | 0 | |
| Youth Party of Slovenia | 46,674 | 4.34 | 4 | New | |
| Greens of Slovenia | 9,691 | 0.90 | 0 | 0 | |
| Democratic Party of Slovenia | 8,079 | 0.75 | 0 | 0 | |
| New Party | 6,338 | 0.59 | 0 | 0 | |
| Voice of Slovenian Women | 4,745 | 0.44 | 0 | New | |
| Forward Slovenia | 3,300 | 0.31 | 0 | 0 | |
| Party of Democratic Action | 3,208 | 0.30 | 0 | New | |
| Communist Party of Slovenia | 1,945 | 0.18 | 0 | 0 | |
| Regional Party of Styria | 732 | 0.07 | 0 | New | |
| Independents | 2,409 | 0.22 | 0 | 0 | |
| Minority representatives | 2 | 0 | |||
| Total | 1,076,520 | 100.00 | 90 | 0 | |
| Valid votes | 1,076,520 | 96.69 | |||
| Invalid/blank votes | 36,904 | 3.31 | |||
| Total votes | 1,113,424 | 100.00 | |||
| Registered voters/turnout | 1,588,528 | 70.09 | |||
| Source: DVK | |||||
References
- ↑ Slovenia: Parliamentary Chamber: Drzavni Zbor Republike Slovenije: Elections held in 2000 Inter-Parliamentary Union
This article is issued from Wikipedia. The text is licensed under Creative Commons - Attribution - Sharealike. Additional terms may apply for the media files.