| ||||||||||||||||||||||||||||||||||||||||||||||||||||||||||||||||||||||||||||||||||||||||||||||||||||||||||||
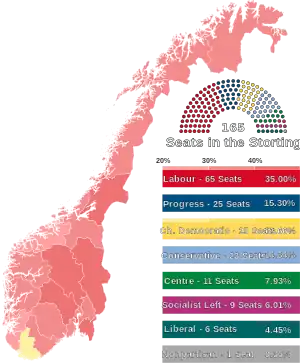
All 165 seats in the Storting 83 seats needed for a majority | ||||||||||||||||||||||||||||||||||||||||||||||||||||||||||||||||||||||||||||||||||||||||||||||||||||||||||||
|---|---|---|---|---|---|---|---|---|---|---|---|---|---|---|---|---|---|---|---|---|---|---|---|---|---|---|---|---|---|---|---|---|---|---|---|---|---|---|---|---|---|---|---|---|---|---|---|---|---|---|---|---|---|---|---|---|---|---|---|---|---|---|---|---|---|---|---|---|---|---|---|---|---|---|---|---|---|---|---|---|---|---|---|---|---|---|---|---|---|---|---|---|---|---|---|---|---|---|---|---|---|---|---|---|---|---|---|---|
| ||||||||||||||||||||||||||||||||||||||||||||||||||||||||||||||||||||||||||||||||||||||||||||||||||||||||||||
 Results by county | ||||||||||||||||||||||||||||||||||||||||||||||||||||||||||||||||||||||||||||||||||||||||||||||||||||||||||||
| ||||||||||||||||||||||||||||||||||||||||||||||||||||||||||||||||||||||||||||||||||||||||||||||||||||||||||||
_(cropped).jpg.webp)


.jpg.webp)

Parliamentary elections were held in Norway on 14 and 15 September 1997.[1] Prior to the election Prime Minister Thorbjørn Jagland of the Labour Party had issued the 36.9 ultimatum declaring that the government would step down unless it gained 36.9% of the vote, the percentage gained by the Labour Party in 1993 under Gro Harlem Brundtland. Whilst Labour won a plurality of seats, they were unable to reach Jagland's 36.9% threshold, gaining 35% of the vote.
As a result of this, the Labour government stepped down, being replaced by a centrist coalition of the Christian People's Party, Liberal Party and the Centre Party, with Kjell Magne Bondevik being appointed Prime Minister, and confidence and supply support from the Conservative Party and the right-wing Progress Party.
Campaign
Political parties
| Name | Ideology | Position | Leader | 1993 result | |||
|---|---|---|---|---|---|---|---|
| Votes (%) | Seats | ||||||
| Ap | Labour Party Arbeiderpartiet |
Social democracy | Centre-left | Thorbjørn Jagland | 36.9% | 67 / 165 | |
| H | Conservative Party Høyre |
Liberal conservatism | Centre-right | Jan Petersen | 17.0% | 28 / 165 | |
| Sp | Centre Party Senterpartiet |
Agrarianism | Centre | Anne Enger Lahnstein | 16.7% | 32 / 165 | |
| SV | Socialist Left Party Sosialistisk Venstreparti |
Democratic socialism | Left-wing | Kristin Halvorsen | 7.9% | 13 / 165 | |
| KrF | Christian Democratic Party Kristelig Folkeparti |
Christian democracy | Centre to centre-right | Kjell Magne Bondevik | 7.8% | 13 / 165 | |
| FrP | Progress Party Fremskrittspartiet |
Conservative liberalism | Right-wing | Carl I. Hagen | 6.2% | 10 / 165 | |
| V | Liberal Party Venstre |
Social liberalism | Centre | Lars Sponheim | 3.6% | 1 / 165 | |
| R | Red Electoral Alliance Rød Valgallianse |
Communism | Far-left | Aslak Sira Myhre | 1.0% | 1 / 165 | |
Debates
| 1997 Norwegian general election debates | |||||||||||
|---|---|---|---|---|---|---|---|---|---|---|---|
| Date | Time | Organizers | P Present I Invitee N Non-invitee | ||||||||
| Ap | H | Sp | Sv | KrF | Frp | V | R | Refs | |||
| 12 Sep | 00:00 | NRK | P Thorbjørn Jagland, Hill-Marta Solberg |
P Jan Petersen |
P Anne Enger Lahnstein |
P Kristin Halvorsen |
P Valgerd Svarstad Haugland |
P Carl I. Hagen |
P Lars Sponheim |
P Aslak Sira Myhre |
[2] |
Results
 | |||||
|---|---|---|---|---|---|
| Party | Votes | % | Seats | +/– | |
| Labour Party | 904,362 | 35.00 | 65 | –2 | |
| Progress Party | 395,376 | 15.30 | 25 | +15 | |
| Conservative Party | 370,441 | 14.34 | 23 | –5 | |
| Christian Democratic Party | 353,082 | 13.66 | 25 | +12 | |
| Centre Party | 204,824 | 7.93 | 11 | –21 | |
| Socialist Left Party | 155,307 | 6.01 | 9 | –4 | |
| Liberal Party | 115,077 | 4.45 | 6 | +5 | |
| Red Electoral Alliance | 43,252 | 1.67 | 0 | –1 | |
| Pensioners' Party | 16,031 | 0.62 | 0 | 0 | |
| Non-Partisan Deputies | 9,195 | 0.36 | 1 | +1 | |
| Environment Party The Greens | 5,884 | 0.23 | 0 | 0 | |
| Fatherland Party | 3,805 | 0.15 | 0 | 0 | |
| Natural Law Party | 2,207 | 0.09 | 0 | 0 | |
| Communist Party | 1,979 | 0.08 | 0 | 0 | |
| Christian Conservative Party | 1,386 | 0.05 | 0 | 0 | |
| New Future Coalition Party | 491 | 0.02 | 0 | 0 | |
| White Electoral Alliance | 463 | 0.02 | 0 | New | |
| Justice Party | 281 | 0.01 | 0 | New | |
| Liberal People's Party | 258 | 0.01 | 0 | 0 | |
| Children–Elderly | 246 | 0.01 | 0 | New | |
| Society Party | 214 | 0.01 | 0 | 0 | |
| Total | 2,584,161 | 100.00 | 165 | 0 | |
| Valid votes | 2,584,161 | 99.63 | |||
| Invalid/blank votes | 9,508 | 0.37 | |||
| Total votes | 2,593,669 | 100.00 | |||
| Registered voters/turnout | 3,311,190 | 78.33 | |||
| Source: Nohlen & Stöver, European Elections Database | |||||
Seat distribution
| Constituency | Total seats |
Seats won | |||||||
|---|---|---|---|---|---|---|---|---|---|
| Ap | Frp | KrF | H | Sp | SV | V | TVF | ||
| Akershus | 14 | 5 | 2 | 1 | 3 | 1 | 1 | 1 | |
| Aust-Agder | 4 | 2 | 1 | 1 | |||||
| Buskerud | 7 | 4 | 1 | 1 | 1 | ||||
| Finnmark | 4 | 2 | 1 | 1 | |||||
| Hedmark | 9 | 4 | 1 | 1 | 1 | 1 | 1 | ||
| Hordaland | 16 | 5 | 2 | 3 | 2 | 1 | 1 | 2 | |
| Møre og Romsdal | 10 | 3 | 2 | 2 | 1 | 1 | 1 | ||
| Nord-Trøndelag | 6 | 3 | 1 | 1 | 1 | ||||
| Nordland | 12 | 5 | 1 | 2 | 1 | 1 | 1 | 1 | |
| Oppland | 7 | 4 | 1 | 1 | 1 | ||||
| Oslo | 17 | 6 | 3 | 1 | 4 | 2 | 1 | ||
| Østfold | 8 | 4 | 2 | 1 | 1 | ||||
| Rogaland | 12 | 3 | 2 | 2 | 2 | 1 | 1 | 1 | |
| Sogn og Fjordane | 5 | 2 | 1 | 1 | 1 | ||||
| Sør-Trøndelag | 10 | 4 | 1 | 1 | 2 | 1 | 1 | ||
| Telemark | 6 | 3 | 1 | 1 | 1 | ||||
| Troms | 6 | 2 | 1 | 1 | 1 | 1 | |||
| Vest-Agder | 5 | 1 | 1 | 2 | 1 | ||||
| Vestfold | 7 | 3 | 2 | 1 | 1 | ||||
| Total | 165 | 65 | 25 | 25 | 23 | 11 | 9 | 6 | 1 |
| Source: Norges Offisielle Statistikk | |||||||||
References
- ↑ Dieter Nohlen & Philip Stöver (2010) Elections in Europe: A data handbook, p1438 ISBN 978-3-8329-5609-7
- ↑ "Partilederdebatt". 15 August 2015.
| Parliamentary elections |
|
|---|---|
| Local elections | |
| Sámi elections | |
| Referendums | |