| ||||||||||||||||||||||||||
| ||||||||||||||||||||||||||
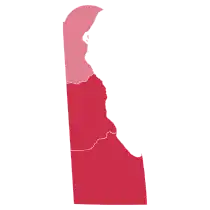
 County Results
Reagan 50–60% 60–70%
| ||||||||||||||||||||||||||
| ||||||||||||||||||||||||||
| Elections in Delaware |
|---|
 |
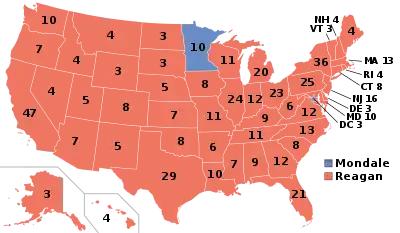
The 1984 United States presidential election in Delaware took place on November 6, 1984. All 50 states and the District of Columbia, were part of the 1984 United States presidential election. State voters chose three electors to the Electoral College, which selected the president and vice president of the United States. Delaware was won by incumbent United States president Ronald Reagan of California, who was running against former vice president Walter Mondale of Minnesota. Reagan ran for a second time with former C.I.A. Director George H. W. Bush of Texas, and Mondale ran with Representative Geraldine Ferraro of New York, the first major female candidate for the vice presidency.
The presidential election of 1984 was a very partisan election for Delaware, with over 99% of the electorate voting either Democratic or Republican, though 6 parties appeared on the ballot.[1] All three of Delaware's counties gave Reagan an outright majority.
Reagan won Delaware by just shy of 20%, which made Delaware about 1% more Republican than the nation at large. His strongest county was Sussex County, Delaware's southernmost county, where he received over 2/3 of the vote. He also received over 60% in Delaware's middle county, Kent County. In New Castle County, Delaware's northernmost and most populous county, Reagan won by double digits, but was held to a 14.5% margin, discernibly less than his national margin.
Results
| 1984 United States presidential election in Delaware | |||||
|---|---|---|---|---|---|
| Party | Candidate | Votes | Percentage | Electoral votes | |
| Republican | Ronald Reagan (incumbent) | 152,190 | 59.78% | 3 | |
| Democratic | Walter Mondale | 101,656 | 39.93% | 0 | |
| American Party | Delmar Dennis | 269 | 0.11% | 0 | |
| Libertarian | David Bergland | 268 | 0.11% | 0 | |
| Citizen's Party | Sonia Johnson | 121 | 0.05% | 0 | |
| New Alliance Party | Dennis Serrette | 68 | 0.03% | 0 | |
| Totals | 254,572 | 100.00% | 3 | ||
Results by county
| County | Reagan | Votes | Mondale | Votes | Other | Votes |
|---|---|---|---|---|---|---|
| New Castle | 57.1% | 102,322 | 42.6% | 76,238 | 0.3% | 517 |
| Kent | 64.5% | 21,531 | 35.3% | 11,789 | 0.3% | 83 |
| Sussex | 67.3% | 28,337 | 32.4% | 13,629 | 0.3% | 126 |
See also
References
- ↑ "Dave Leip's Atlas of U.S. Presidential Elections". Uselectionatlas.org. Retrieved November 11, 2013.
.jpg.webp)
.jpg.webp)
