| ||||||||||||||||||||||||||
| ||||||||||||||||||||||||||
| ||||||||||||||||||||||||||
| Elections in Maryland |
|---|
.svg.png.webp) |
|
|
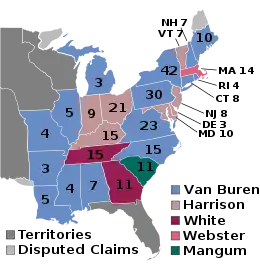
The 1836 United States presidential election in Maryland took place between November 3 and December 7, 1836, as part of the 1836 United States presidential election. Voters chose 10 representatives, or electors to the Electoral College,[1] who voted for President and Vice President.
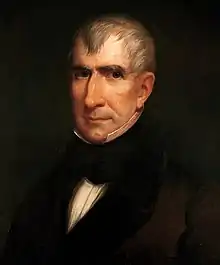
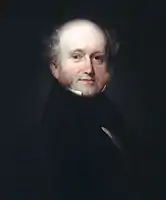
Maryland voted for Whig candidate William Henry Harrison over the Democratic candidate, Martin Van Buren. Harrison won Maryland by a margin of 7.46%.
Results
| 1836 United States presidential election in Maryland[2] | |||||
|---|---|---|---|---|---|
| Party | Candidate | Votes | Percentage | Electoral votes | |
| Whig | William Henry Harrison | 25,852 | 53.73% | 10 | |
| Democratic | Martin Van Buren | 22,267 | 46.27% | 0 | |
| Totals | 48,119 | 100.0% | 10 | ||
Results by county
| County | William Henry Harrison
Whig |
Martin Van Buren
Democratic |
Margin | Total
Votes Cast [3] | |||
|---|---|---|---|---|---|---|---|
| # | % | # | % | # | % | ||
| Allegany | 926 | 56.77% | 705 | 43.23% | 221 | 13.55% | 1631 |
| Anne Arundel | 1248 | 55.25% | 1011 | 44.75% | 237 | 10.49% | 2259 |
| Baltimore (City and County) | 6699 | 44.89% | 8222 | 55.11% | -1523 | -10.22% | 14,921 |
| Calvert | 363 | 56.11% | 284 | 43.89% | 79 | 12.21% | 647 |
| Caroline | 576 | 53.93% | 492 | 46.07% | 84 | 7.87% | 1068 |
| Cecil | 1020 | 48.30% | 1092 | 51.70% | -72 | -3.41% | 2112 |
| Charles | 514 | 59.08% | 356 | 40.92% | 158 | 18.16% | 870 |
| Dorchester | 966 | 58.19% | 694 | 41.81% | 272 | 16.39% | 1660 |
| Frederick | 3130 | 50.94% | 3015 | 49.06% | 115 | 1.87% | 6145 |
| Harford | 1080 | 54.00% | 920 | 46.00% | 160 | 8.00% | 2000 |
| Kent | 589 | 61.61% | 367 | 38.39% | 222 | 23.22% | 956 |
| Montgomery | 936 | 64.51% | 515 | 35.49% | 421 | 29.01% | 1451 |
| Prince George's | 728 | 61.80% | 450 | 38.20% | 278 | 23.60% | 1178 |
| Queen Anne's | 637 | 55.20% | 517 | 44.80% | 120 | 10.40% | 1154 |
| St. Mary's | 643 | 77.19% | 190 | 22.81% | 453 | 54.38% | 833 |
| Somerset | 1030 | 66.32% | 523 | 33.68% | 507 | 32.65% | 1553 |
| Talbot | 656 | 57.80% | 479 | 42.20% | 177 | 15.59% | 1135 |
| Washington | 2079 | 51.03% | 1995 | 48.97% | 84 | 2.06% | 4074 |
| Worcester | 1032 | 65.61% | 541 | 34.39% | 491 | 31.21% | 1573 |
| Total | 25852 | 53.73% | 22267 | 46.27% | 3585 | 7.46% | 481119 |
Counties that flipped from Democratic to Whig
Counties that flipped from National Republican to Whig
See also
References
- ↑ "Archives of Maryland Historical List of Presidential Electors in Maryland, 1789-2016". Maryland.gov. June 18, 2019. Archived from the original on May 30, 2022. Retrieved August 6, 2022.
- ↑ "1836 Presidential General Election Results - Maryland". U.S. Election Atlas. Retrieved August 4, 2012.
- ↑ "County Project (WIP)". Google Docs. Retrieved November 1, 2022.
This article is issued from Wikipedia. The text is licensed under Creative Commons - Attribution - Sharealike. Additional terms may apply for the media files.


