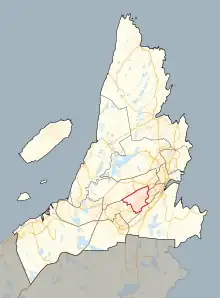
 Location in the St. John's area | |||
| Provincial electoral district | |||
| Legislature | Newfoundland and Labrador House of Assembly | ||
| MHA |
Liberal | ||
| District created | 1949 | ||
| First contested | 1949 | ||
| Last contested | 2021 | ||
| Demographics | |||
| Population (2006) | 11,805 | ||
| Electors (2011) | 7,741 | ||
| Area (km²) | 10 | ||
| Census division(s) | Division No. 1 | ||
| Census subdivision(s) | St. John's | ||
St. John’s West is a provincial electoral district for the House of Assembly of Newfoundland and Labrador, Canada. As of 2011, there are 7,741 eligible voters living within the district.[1]
The district is largely residential and middle class and includes the Cowan Heights area. Prior to 1956, the district was larger and elected two MHAs.
The district is represented by Cabinet Minister Siobhan Coady.
From 1949 to 1975, it elected two MLAs through Block voting. Since 1975 it has elected a single MLA through First past the post.
Members of the House of Assembly
The following Members of the House of Assembly have been elected in St. John's West:
| Assembly | Years | Member | Party | |
|---|---|---|---|---|
| 29th | 1949–1951 | James Spratt | Liberal | |
| Oliver Vardy | ||||
| 30th | 1949–1951 | |||
| 1951–1956 | Peter Cashin | Progressive Conservative | ||
| 1951–1956 | Malcolm Hollett | |||
| 31st | 1956–1959 | |||
| 32nd | 1959–1962 | Joseph R. Smallwood | Liberal | |
| 33rd | 1962–1966 | William G. Adams | ||
| 34th | 1966–1969 | John Crosbie | ||
| 1969–1971 | Progressive Conservative | |||
| 35th | 1972 | |||
| 36th | 1972–1975 | |||
| 37th | 1975–1977 | |||
| 1977–1979 | Hubert Kitchen | Liberal | ||
| 38th | 1979–1982 | Hal Barrett | Progressive Conservative | |
| 39th | 1982–1985 | |||
| 40th | 1985–1989 | |||
| 41st | 1989–1993 | Rex Gibbons | Liberal | |
| 42nd | 1993–1996 | |||
| 43rd | 1996–1997 | |||
| 1997–1999 | Sheila Osborne | Progressive Conservative | ||
| 44th | 1999–2003 | |||
| 45th | 2003–2007 | |||
| 46th | 2007–2011 | |||
| 47th | 2011–2015 | Dan Crummell | ||
| 48th | 2015–2019 | Siobhán Coady | Liberal | |
| 49th | 2019–2021 | |||
| 50th | 2021–present | |||
Election results
Graph of election results (minor parties that never got 2% of the vote or didn't run consistently are omitted)
| 2021 Newfoundland and Labrador general election | ||||||||
|---|---|---|---|---|---|---|---|---|
| Party | Candidate | Votes | % | ±% | ||||
| Liberal | Siobhán Coady | 2,679 | 57.82 | +12.13 | ||||
| Progressive Conservative | Kristina Ennis | 1,484 | 32.03 | -10.19 | ||||
| New Democratic | Brenda Walsh | 470 | 10.14 | -1.94 | ||||
| Total valid votes | ||||||||
| Total rejected ballots | ||||||||
| Turnout | ||||||||
| Eligible voters | ||||||||
| Liberal hold | Swing | +11.16 | ||||||
Source(s)
"Officially Nominated Candidates General Election 2021" (PDF). Elections Newfoundland and Labrador. Retrieved 3 March 2021. "NL Election 2021 (Unofficial Results)". Retrieved 27 March 2021. | ||||||||
| 2019 Newfoundland and Labrador general election | ||||||||
|---|---|---|---|---|---|---|---|---|
| Party | Candidate | Votes | % | ±% | ||||
| Liberal | Siobhán Coady | 2,393 | 45.69 | -0.32 | ||||
| Progressive Conservative | Shane Skinner | 2,211 | 42.22 | +15.42 | ||||
| New Democratic | Brenda Walsh | 633 | 12.09 | -15.10 | ||||
| Total valid votes | 5,237 | 99.37 | ||||||
| Total rejected ballots | 33 | 0.63 | +0.18 | |||||
| Turnout | 5,270 | 57.31 | +1.73 | |||||
| Electors on the lists | 9,195 | – | ||||||
| Liberal hold | Swing | -7.87 | ||||||
| Source: Elections Newfoundland & Labrador[2] | ||||||||
| 2015 Newfoundland and Labrador general election | ||||||||
|---|---|---|---|---|---|---|---|---|
| Party | Candidate | Votes | % | ±% | ||||
| Liberal | Siobhán Coady | 2,342 | 46.01 | +26.76 | ||||
| New Democratic | Earle McCurdy | 1,384 | 27.19 | -10.21 | ||||
| Progressive Conservative | Dan Crummell | 1,364 | 26.80 | -16.55 | ||||
| Total valid votes | 5,090 | 99.55 | ||||||
| Total rejected ballots | 23 | 0.45 | +0.23 | |||||
| Turnout | 5,113 | 55.59 | -4.01 | |||||
| Eligible voters | 9,198 | |||||||
| Liberal gain from Progressive Conservative | Swing | +21.66 | ||||||
| Source: Elections Newfoundland and Labrador[3] | ||||||||
| 2011 Newfoundland and Labrador general election | ||||||||
|---|---|---|---|---|---|---|---|---|
| Party | Candidate | Votes | % | ±% | ||||
| Progressive Conservative | Dan Crummell | 2,004 | 43.35 | -29.33 | ||||
| New Democratic | Chris Pickard | 1,729 | 37.40 | +30.50 | ||||
| Liberal | George Joyce | 890 | 19.25 | -1.17 | ||||
| Total valid votes | 4,623 | 99.78 | ||||||
| Total rejected ballots | 10 | 0.22 | ||||||
| Turnout | 4,633 | 59.60 | ||||||
| Eligible voters | 7,774 | |||||||
| 2007 Newfoundland and Labrador general election | ||||||||
|---|---|---|---|---|---|---|---|---|
| Party | Candidate | Votes | % | ±% | ||||
| Progressive Conservative | Sheila Osborne | 3,623 | 72.68 | -0.47 | ||||
| Liberal | George Joyce | 1,018 | 20.42 | -0.08 | ||||
| New Democratic | Joan Scott | 344 | 6.90 | -0.39 | ||||
| Party | Candidate | Votes | % | ±% | |
|---|---|---|---|---|---|
| Progressive Conservative | Sheila Osborne | 4,557 | 72.21 | – | |
| Liberal | Tom Hann | 1,294 | 20.50 | ||
| NDP | Raj Sharan | 460 | 7.29 | ||
| Party | Candidate | Votes | % | ±% | |
|---|---|---|---|---|---|
| Progressive Conservative | Sheila Osborne | 3,206 | 49.8 | – | |
| Liberal | Tom Moore | 2,532 | 39.3 | ||
| NDP | Pat Lynch | 683 | 10.6 | ||
| Party | Candidate | Votes | % | ±% | |
|---|---|---|---|---|---|
| Liberal | Rex Gibbons | 4,152 | |||
| Progressive Conservative | Bren Kelly | 1,648 | – | – | |
| NDP | Pat Lynch | 651 | |||
| Party | Candidate | Votes | % | ±% | |
|---|---|---|---|---|---|
| Liberal | Rex Gibbons | 3,094 | |||
| Progressive Conservative | Paul Sears | 2,485 | – | – | |
| NDP | Bonnie MacGillivray | 835 | |||
| Party | Candidate | Votes | % | ±% | |
|---|---|---|---|---|---|
| Liberal | Rex Gibbons | 3,389 | |||
| Progressive Conservative | Hal Barrett | 2,583 | – | – | |
| NDP | Larry Power | 380 | |||
| Party | Candidate | Votes | % | ±% | |
|---|---|---|---|---|---|
| Progressive Conservative | Harold Barrett | 3,382 | – | – | |
| Liberal | Gerald Moore | 1,595 | |||
| NDP | Thomas O'Leary | 1,508 | |||
| Party | Candidate | Votes | % | ±% | |
|---|---|---|---|---|---|
| Progressive Conservative | Harold Barrett | 2,475 | – | – | |
| Liberal | Ronald Pumphrey | 755 | |||
| NDP | Ronald Lewis | 225 | |||
References
- ↑ "Summary of Polling Divisions ST. JOHN'S WEST" (PDF). 3 August 2011. Retrieved 4 September 2011.
- ↑ https://www.elections.gov.nl.ca/elections/resources/pdf/electionreports/genelections/GEreport2015.pdf
- ↑ "2015 Provincial General Election Report" (PDF). Elections Newfoundland and Labrador. 25 July 2016. Retrieved 16 May 2019.
- ↑ Newfoundland & Labrador Votes 2007. Canadian Broadcasting Corporation. Retrieved May 22, 2009.
- ↑ Newfoundland & Labrador Votes 2003. Canadian Broadcasting Corporation. Retrieved May 22, 2009.
- ↑ General Election Reports Archived 2011-07-06 at the Wayback Machine. Elections Newfoundland & Labrador.
- 1 2 3 4 5 Report of the Chief Electoral Officer. Retrieved April 13, 2011.
External links
| St. John's |  | |
|---|---|---|
| St. John's suburbs | ||
| Avalon Peninsula | ||
| Eastern Newfoundland | ||
| Central Newfoundland | ||
| Western Newfoundland | ||
| Labrador | ||
This article is issued from Wikipedia. The text is licensed under Creative Commons - Attribution - Sharealike. Additional terms may apply for the media files.