| 6th constituency of Gironde | |
|---|---|
inline National Assembly of France | |
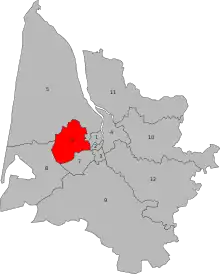
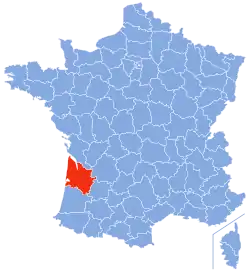
 Location of constituency in Department | |
 | |
| Deputy | |
| Department | Gironde |
| Cantons | (pre-2015) Mérignac I, Mérignac II, Saint-Médard-en-Jalles. |
The 6th constituency of the Gironde (French: Sixième circonscription de la Gironde) is a French legislative constituency in Gironde département. Like the other 576 French constituencies, it elects one MP using the two-round system, with a run-off if no candidate receives over 50% of the vote in the first round.
Historical Representation
| Election | Member | Party | |
|---|---|---|---|
| 1988 | Michel Sainte-Marie | PS | |
| 1993 | Pierre Favre | PR | |
| 1997 | Michel Sainte-Marie | PS | |
| 2002 | |||
| 2007 | |||
| 2012 | Marie Récalde | ||
| 2017 | Éric Poulliat | LREM | |
| 2022 | RE | ||
Election results
2022
| Party | Candidate | Votes | % | ±% | |||
|---|---|---|---|---|---|---|---|
| LREM (Ensemble) | Éric Poulliat | 19,258 | 34.83 | -9.30 | |||
| PS (NUPÉS) | Vanessa Fergeau-Renaux | 18,765 | 33.93 | +1.42 | |||
| RN | Jimmy Bourlieux | 8,222 | 14.87 | +6.47 | |||
| LR (UDC) | Thomas Dovichi | 2,815 | 5.09 | -5.78 | |||
| REC | Jérôme Paris | 2,174 | 3.93 | N/A | |||
| Others | N/A | 4,064 | 7.35 | ||||
| Turnout | 55,298 | 52.22 | +0.05 | ||||
| 2nd round result | |||||||
| LREM (Ensemble) | Éric Poulliat | 26,893 | 51.85 | -6.96 | |||
| PS (NUPÉS) | Vanessa Fergeau-Renaux | 24,969 | 48.15 | +6.96 | |||
| Turnout | 51,862 | 51.09 | +8.25 | ||||
| LREM hold | |||||||
2017
| Candidate | Label | First round | Second round | |||
|---|---|---|---|---|---|---|
| Votes | % | Votes | % | |||
| Éric Poulliat | REM | 23,543 | 44.13 | 23,690 | 58.81 | |
| Marie Récalde | PS | 7,502 | 14.06 | 16,590 | 41.19 | |
| Marie Duret-Pujol | FI | 7,260 | 13.61 | |||
| Rémi Cocuelle | UDI | 5,799 | 10.87 | |||
| Marie-Mauricette Martinez | FN | 4,481 | 8.40 | |||
| Ludovic Guitton | ECO | 1,915 | 3.59 | |||
| Pierre Cazenave | PCF | 668 | 1.25 | |||
| Véronique Silverio | DIV | 629 | 1.18 | |||
| Frédérique Bacci | ECO | 449 | 0.84 | |||
| Sandrine Peny | DLF | 418 | 0.78 | |||
| Olivier Loisel | DIV | 373 | 0.70 | |||
| Guillaume Perchet | EXG | 280 | 0.52 | |||
| Frédéric Dossche | DIV | 31 | 0.06 | |||
| Votes | 53,348 | 100.00 | 40,280 | 100.00 | ||
| Valid votes | 53,348 | 98.58 | 40,280 | 90.65 | ||
| Blank votes | 565 | 1.04 | 2,882 | 6.49 | ||
| Null votes | 203 | 0.38 | 1,274 | 2.87 | ||
| Turnout | 54,116 | 52.17 | 44,436 | 42.84 | ||
| Abstentions | 49,612 | 47.83 | 59,292 | 57.16 | ||
| Registered voters | 103,728 | 103,728 | ||||
| Source: Ministry of the Interior[2] | ||||||
2012
| Candidate | Party | First round | Second round | ||||||||
|---|---|---|---|---|---|---|---|---|---|---|---|
| Votes | % | Votes | % | ||||||||
| Marie Recalde | PS | 27,211 | 48.22% | 32,863 | 63.43% | ||||||
| Thierry Millet | NC | 14,292 | 25.33% | 18,948 | 36.57% | ||||||
| Jean-Luc Aupetit | FN | 5,636 | 9.99% | ||||||||
| Joël Saintier | FG | 2,975 | 5.27% | ||||||||
| Gérard Chausset | EELV | 2,501 | 4.43% | ||||||||
| Pierre Braun | MoDem | 1,969 | 3.49% | ||||||||
| Bernard Gonzalez | DLR | 627 | 1.11% | ||||||||
| Philippe Rouze | NPA | 361 | 0.64% | ||||||||
| Sylvie Ferrari | MEI | 350 | 0.62% | ||||||||
| Juliette Toubiana | AEI | 265 | 0.47% | ||||||||
| Nelly Malaty | LO | 239 | 0.42% | ||||||||
| Valid votes | 56,426 | 98.96% | 51,811 | 97.43% | |||||||
| Spoilt and null votes | 594 | 1.04% | 1,369 | 2.57% | |||||||
| Votes cast / turnout | 57,020 | 59.87% | 53,180 | 55.81% | |||||||
| Abstentions | 38,220 | 40.13% | 42,111 | 44.19% | |||||||
| Registered voters | 95,240 | 100.00% | 95,291 | 100.00% | |||||||
2007
| Party | Candidate | Votes | % | ±% | |||
|---|---|---|---|---|---|---|---|
| PS | Michel Sainte-Marie | 21,308 | 37.58 | ||||
| UMP | Marie-Hélène Mutter | 14,963 | 26.39 | ||||
| MoDem | Jacques Mangon | 6,401 | 11.29 | ||||
| LC | Thierry Millet | 5,789 | 10.21 | ||||
| LV | Xavier Lhomme | 2,248 | 3.96 | ||||
| Far left | Jean-Marie Benaben | 1,529 | 2.70 | ||||
| FN | Diéderik Meynier | 1,352 | 2.38 | ||||
| PCF | Michelle Iste | 1,205 | 2.13 | ||||
| Others | N/A | 1,910 | |||||
| Turnout | 57,405 | 64.29 | |||||
| 2nd round result | |||||||
| PS | Michel Sainte-Marie | 31,740 | 57.19 | ||||
| UMP | Marie-Hélène Mutter | 23,757 | 42.81 | ||||
| Turnout | 56,891 | 63.71 | |||||
| PS hold | |||||||
2002
| Party | Candidate | Votes | % | ±% | |||
|---|---|---|---|---|---|---|---|
| PS | Michel Sainte-Marie | 21,362 | 38.53 | ||||
| UMP | Pierre Favre | 20,365 | 36.73 | ||||
| FN | Valerie Colombier | 4,358 | 7.86 | ||||
| LV | Gerard Chausset | 2,221 | 4.01 | ||||
| LMR | Jean-Jose Demanes | 1,518 | 2.74 | ||||
| PCF | Line Peron | 1,363 | 2.46 | ||||
| Others | N/A | 4,260 | |||||
| Turnout | 56,292 | 70.29 | |||||
| 2nd round result | |||||||
| PS | Michel Sainte-Marie | 26,108 | 51.59 | ||||
| UMP | Pierre Favre | 24,499 | 48.41 | ||||
| Turnout | 52,084 | 65.03 | |||||
| PS hold | |||||||
1997
| Party | Candidate | Votes | % | ±% | |||
|---|---|---|---|---|---|---|---|
| PS | Michel Sainte-Marie | 18,415 | 37.16 | ||||
| UDF | Pierre Favre | 14,834 | 29.93 | ||||
| FN | François-Régis Taveau | 5,186 | 10.46 | ||||
| PCF | Denis Lacoste | 3,598 | 7.26 | ||||
| LV | Xavier Svahn | 1,595 | 3.22 | ||||
| GE | Stéphane Lacaze | 1,468 | 2.96 | ||||
| LO | Nelly Malaty | 1,429 | 2.88 | ||||
| Others | N/A | 3,037 | |||||
| Turnout | 51,771 | 69.83 | |||||
| 2nd round result | |||||||
| PS | Michel Sainte-Marie | 28,962 | 55.75 | ||||
| UDF | Pierre Favre | 22,991 | 44.25 | ||||
| Turnout | 54,730 | 73.82 | |||||
| PS gain from UDF | |||||||
References
- ↑ "Résultats des élections législatives 2022 en Gironde". Le Monde.fr (in French). Retrieved 12 September 2022.
- ↑ "Résultats des élections législatives 2017" [Results of 2017 Legislative Election] (in French). Ministry of the Interior.
- ↑ "Résultats des élections législatives 2012" [Results of 2012 Legislative Election] (in French). Ministry of the Interior.
Sources
- French Interior Ministry results website: "Résultats électoraux officiels en France" (in French).
This article is issued from Wikipedia. The text is licensed under Creative Commons - Attribution - Sharealike. Additional terms may apply for the media files.