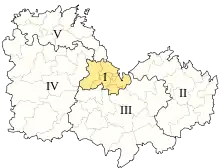
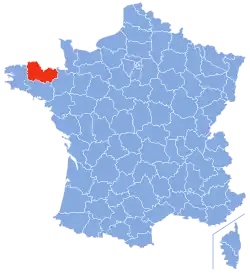
| 1st constituency of the Côtes-d'Armor | |
|---|---|
inline National Assembly of France | |
 Constituency in department | |
 | |
| Deputy | Mickaël Cosson MoDem |
| Department | Côtes-d'Armor |
| Cantons | Châtelaudren, Langueux, Plérin, Ploufragan, Saint-Brieuc Nord, Saint-Brieuc Ouest, Saint-Brieuc Sud. |
The 1st constituency of the Côtes-d'Armor is a French legislative constituency in the Côtes-d'Armor département in Brittany. Like the other 576 French constituencies, it elects one MP using the two-round system, with a run-off if no candidate receives over 50% of the vote in the first round.
Geography
The constituency is anchored by the town of Saint-Brieuc.
Deputies
| Election | Member | Party | |
|---|---|---|---|
| 1958 | Victor Rault | MRP | |
| 1962 | Robert Richet | UNR | |
| 1967 | Yves Le Foll | PSU | |
| 1968 | Arthur Charles | Non-affiliated | |
| 1973 | Yves Le Foll | PSU | |
| 1978 | Sébastien Couépel | UDF | |
| 1981 | Yves Dollo | PS | |
| 1986 | Proportional representation - no election by constituency | ||
| 1988 | Yves Dollo | PS | |
| 1993 | Christian Daniel | RPR | |
| 1997 | Danielle Bousquet | PS | |
| 2002 | |||
| 2007 | |||
| 2012 | Michel Lesage | PS | |
| 2017 | Bruno Joncour | MoDem | |
| 2022 | Mickaël Cosson | ||
Election results
2022
| Party | Candidate | Votes | % | ±% | |||
|---|---|---|---|---|---|---|---|
| LFI (NUPÉS) | Marion Gorgiard | 13,092 | 27.49 | -7.76 | |||
| MoDem (Ensemble) | Mickaël Cosson | 11,817 | 24.81 | -16.39 | |||
| RN | Françoise Billaud | 5,904 | 12.40 | +5.00 | |||
| PS | Loïc Raoult* | 4,689 | 9.84 | N/A | |||
| Horizons | Thierry Simeliere** | 3,502 | 7.35 | N/A | |||
| DVD | Stéphane Briend | 3,047 | 6.40 | N/A | |||
| REC | Pierre-Yves Thomas | 1,215 | 2.55 | N/A | |||
| DVC | Romain Faligot | 1,197 | 2.51 | N/A | |||
| Others | N/A | 3,168 | 6.65 | ||||
| Turnout | 47,631 | 53.05 | -2.12 | ||||
| 2nd round result | |||||||
| MoDem (Ensemble) | Mickaël Cosson | 24,043 | 52.39 | -7.65 | |||
| LFI (NUPÉS) | Marion Gorgiard | 21,845 | 47.61 | +7.65 | |||
| Turnout | 45,888 | 53.39 | +7.00 | ||||
| MoDem hold | |||||||
* PS dissident
** Horizons dissident
2017
| Candidate | Label | First round | Second round | |||
|---|---|---|---|---|---|---|
| Votes | % | Votes | % | |||
| Bruno Joncour | MoDem | 19,951 | 41.20 | 22,233 | 60.04 | |
| Michel Lesage | PS | 6,691 | 13.82 | 14,795 | 39.96 | |
| Marion Gorgiard | FI | 6,078 | 12.55 | |||
| Sylvie Grondin | LR | 5,379 | 11.11 | |||
| Pierre-Yves Lopin | FN | 3,582 | 7.40 | |||
| Aurélien Danvert | ECO | 2,578 | 5.32 | |||
| Jean-François Philippe | PCF | 1,725 | 3.56 | |||
| Pascal Laporte | REG | 1,062 | 2.19 | |||
| Alain Le Fol | EXG | 435 | 0.90 | |||
| Joannic Martin | REG | 394 | 0.81 | |||
| Gwenaëlle Gesret | DIV | 281 | 0.58 | |||
| Hervé Denis | EXG | 265 | 0.55 | |||
| Guillaume Ropars | DIV | 1 | 0.00 | |||
| Votes | 48,422 | 100.00 | 37,028 | 100.00 | ||
| Valid votes | 48,422 | 97.71 | 37,028 | 88.87 | ||
| Blank votes | 790 | 1.59 | 3,034 | 7.28 | ||
| Null votes | 344 | 0.69 | 1,602 | 3.85 | ||
| Turnout | 49,556 | 55.17 | 41,664 | 46.39 | ||
| Abstentions | 40,261 | 44.83 | 48,151 | 53.61 | ||
| Registered voters | 89,817 | 89,815 | ||||
| Source:[1] | ||||||
2012
| Candidate | Party | First round | Second round | ||||||||
|---|---|---|---|---|---|---|---|---|---|---|---|
| Votes | % | Votes | % | ||||||||
| Michel Lesage | PS | 24,922 | 46.68% | 33,417 | 65.86% | ||||||
| Sylvie Grondin | UMP | 13,434 | 25.16% | 17,321 | 34.14% | ||||||
| Jean-François Philippe | FG | 5,043 | 9.45% | ||||||||
| Céline Lelaumier | FN | 4,599 | 8.61% | ||||||||
| Thierry Stiefvater | UDB–EELV | 3,024 | 5.66% | ||||||||
| Samuel Burlot | NPA | 767 | 1.44% | ||||||||
| Yamina El Harouat | NC | 647 | 1.21% | ||||||||
| Alain Le Fol | LO | 444 | 0.83% | ||||||||
| Hervé Denis | POI | 259 | 0.49% | ||||||||
| Julien Petit | SP | 246 | 0.46% | ||||||||
| Valid votes | 53,385 | 98.09% | 50,738 | 96.20% | |||||||
| Spoilt and null votes | 1,041 | 1.91% | 2,005 | 3.80% | |||||||
| Votes cast / turnout | 54,426 | 61.10% | 52,743 | 59.24% | |||||||
| Abstentions | 34,656 | 38.90% | 36,290 | 40.76% | |||||||
| Registered voters | 89,082 | 100.00% | 89,033 | 100.00% | |||||||
2007
| Party | Candidate | Votes | % | ±% | |
|---|---|---|---|---|---|
| PS | Danielle Bousquet | 32,606 | 57.72 | ||
| UMP | Alain Cadec | 23,880 | 42.28 | ||
| Turnout | 57,919 | 65.46 | |||
| PS hold | Swing | ||||
Sources
- Official results of French elections from 1998: "Résultats électoraux officiels en France" (in French). Archived from the original on 20 December 2011. Retrieved 19 June 2008.
- ↑ "Résultats des élections législatives 2017" [Results of 2017 Legislative Election] (in French). Ministry of the Interior.
- ↑ "Résultats des élections législatives 2012" [Results of 2012 Legislative Election] (in French). Ministry of the Interior.
This article is issued from Wikipedia. The text is licensed under Creative Commons - Attribution - Sharealike. Additional terms may apply for the media files.