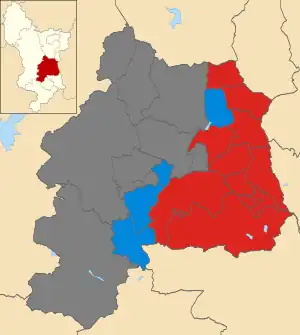
Map of the results of the 2002 Amber Valley council election. Labour in red and Conservatives in blue. Wards in grey were not contested in 2002.
Elections to Amber Valley Borough Council were held on 2 May 2002. One third of the council was up for election and the Conservative Party held overall control of the council.
After the election, the composition of the council was:
- Conservative 26
- Labour 19
Election result
| Party | Seats | Gains | Losses | Net gain/loss | Seats % | Votes % | Votes | +/− | |
|---|---|---|---|---|---|---|---|---|---|
| Labour | 12 | +7 | 75.0 | 52.5 | 11,496 | ||||
| Conservative | 4 | -6 | 25.0 | 37.1 | 8,115 | ||||
| Liberal Democrats | 0 | 0 | 0 | 5.6 | 1,217 | ||||
| Independent | 0 | -1 | 0 | 4.4 | 955 | ||||
| Green | 0 | 0 | 0 | 0.5 | 107 | ||||
Ward results
| Party | Candidate | Votes | % | ±% | |
|---|---|---|---|---|---|
| Labour | John Walker | 1,023 | 63.1 | ||
| Independent | Colin Thornton | 409 | 25.2 | ||
| Liberal Democrats | Paul Gibbons | 188 | 11.6 | ||
| Majority | 614 | 37.9 | |||
| Turnout | 1,620 | ||||
| Labour gain from Independent | Swing | ||||
| Party | Candidate | Votes | % | ±% | |
|---|---|---|---|---|---|
| Conservative | Martin Tomlinson | 506 | 46.6 | ||
| Labour | Nalda Boyes-Jackson | 473 | 43.6 | ||
| Green | Hugh Stewart | 107 | 9.9 | ||
| Majority | 33 | 3.0 | |||
| Turnout | 1,086 | ||||
| Conservative hold | Swing | ||||
| Party | Candidate | Votes | % | ±% | |
|---|---|---|---|---|---|
| Conservative | James Anderson | 580 | 50.04 | ||
| Labour | Peter Shepherd | 579 | 49.96 | ||
| Majority | 1 | 0.08 | |||
| Turnout | 1,159 | ||||
| Conservative hold | Swing | ||||
| Party | Candidate | Votes | % | ±% | |
|---|---|---|---|---|---|
| Labour | Ian Fisher | 871 | 66.9 | ||
| Conservative | David Cattermole | 430 | 33.1 | ||
| Majority | 441 | 33.8 | |||
| Turnout | 1,301 | ||||
| Labour gain from Conservative | Swing | ||||
| Party | Candidate | Votes | % | ±% | |
|---|---|---|---|---|---|
| Conservative | Chris Short | 865 | 60.1 | ||
| Labour | Patrick Mountain | 574 | 39.9 | ||
| Majority | 391 | 20.2 | |||
| Turnout | 1,439 | ||||
| Conservative hold | Swing | ||||
| Party | Candidate | Votes | % | ±% | |
|---|---|---|---|---|---|
| Labour | Bob Moon | 725 | 65.8 | ||
| Conservative | Christopher Jubb | 376 | 34.2 | ||
| Majority | 349 | 31.6 | |||
| Turnout | 1,101 | ||||
| Labour hold | Swing | ||||
| Party | Candidate | Votes | % | ±% | |
|---|---|---|---|---|---|
| Labour | Glynne Cato | 548 | 53.8 | ||
| Conservative | Enid Trusswell | 272 | 26.7 | ||
| Independent | Alex Stevenson | 129 | 12.7 | ||
| Liberal Democrats | Keith Falconbridge | 70 | 6.9 | ||
| Majority | 276 | 27.1 | |||
| Turnout | 1,019 | ||||
| Labour hold | Swing | ||||
| Party | Candidate | Votes | % | ±% | |
|---|---|---|---|---|---|
| Labour | Paul Jones | 601 | 47.1 | ||
| Liberal | Judith Wooley | 413 | 32.3 | ||
| Conservative | Ruth Bulkeley-Kirkham | 263 | 20.6 | ||
| Majority | 188 | 14.8 | |||
| Turnout | 1,277 | ||||
| Labour hold | Swing | ||||
| Party | Candidate | Votes | % | ±% | |
|---|---|---|---|---|---|
| Labour | David Griffiths | 778 | 58.1 | ||
| Conservative | George Cope | 560 | 41.9 | ||
| Majority | 218 | 16.2 | |||
| Turnout | 1,338 | ||||
| Labour gain from Conservative | Swing | ||||
| Party | Candidate | Votes | % | ±% | |
|---|---|---|---|---|---|
| Labour | John Grace | 862 | 44.3 | ||
| Conservative | Alan Warner | 808 | 41.6 | ||
| Liberal Democrats | Jeremy Benson | 274 | 14.1 | ||
| Majority | 54 | 2.7 | |||
| Turnout | 1,944 | ||||
| Labour gain from Conservative | Swing | ||||
| Party | Candidate | Votes | % | ±% | |
|---|---|---|---|---|---|
| Labour | Jo Ward | 504 | 59.2 | ||
| Conservative | Ann Castledine | 200 | 23.5 | ||
| Independent | Denis Woolley | 148 | 17.4 | ||
| Majority | 304 | 35.7 | |||
| Turnout | 852 | ||||
| Labour hold | Swing | ||||
| Party | Candidate | Votes | % | ±% | |
|---|---|---|---|---|---|
| Labour | Charles Cutting | 902 | |||
| Labour | Geoffrey Carlile | 833 | |||
| Conservative | Kathleen Brown | 812 | |||
| Conservative | Peter Clay | 736 | |||
| Liberal Democrats | Kate Smith | 272 | |||
| Turnout | 3,555 | ||||
| Labour gain from Conservative | Swing | ||||
| Labour gain from Conservative | Swing | ||||
| Party | Candidate | Votes | % | ±% | |
|---|---|---|---|---|---|
| Labour | Eric Lancashire | 771 | 46.9 | ||
| Conservative | Linda Edward-Milson | 603 | 36.7 | ||
| Independent | Margaret Jackson | 269 | 16.4 | ||
| Majority | 168 | 10.2 | |||
| Turnout | 1,643 | ||||
| Labour gain from Conservative | Swing | ||||
| Party | Candidate | Votes | % | ±% | |
|---|---|---|---|---|---|
| Labour | Alan Stringer | 965 | 75.9 | ||
| Conservative | Geoffrey Brailsford | 307 | 24.1 | ||
| Majority | 658 | 51.8 | |||
| Turnout | 1,272 | ||||
| Labour hold | Swing | ||||
| Party | Candidate | Votes | % | ±% | |
|---|---|---|---|---|---|
| Conservative | Allen King | 797 | 62.1 | ||
| Labour | Jonathan Harris | 487 | 37.9 | ||
| Majority | 310 | 24.2 | |||
| Turnout | 1,284 | ||||
| Conservative hold | Swing | ||||
External links
This article is issued from Wikipedia. The text is licensed under Creative Commons - Attribution - Sharealike. Additional terms may apply for the media files.